
Shipping Under Pressure
AFTER enjoying a continuing boom for four years up to late 2008, the international shipping markets hit a wall, and thereafter started to slide down it. Although there has been a recovery from that freight market nadir, the six years from 2009 to 2014 have been very challenging in terms of trying to achieve a reasonable return from the tanker, dry bulk and container ship sectors.
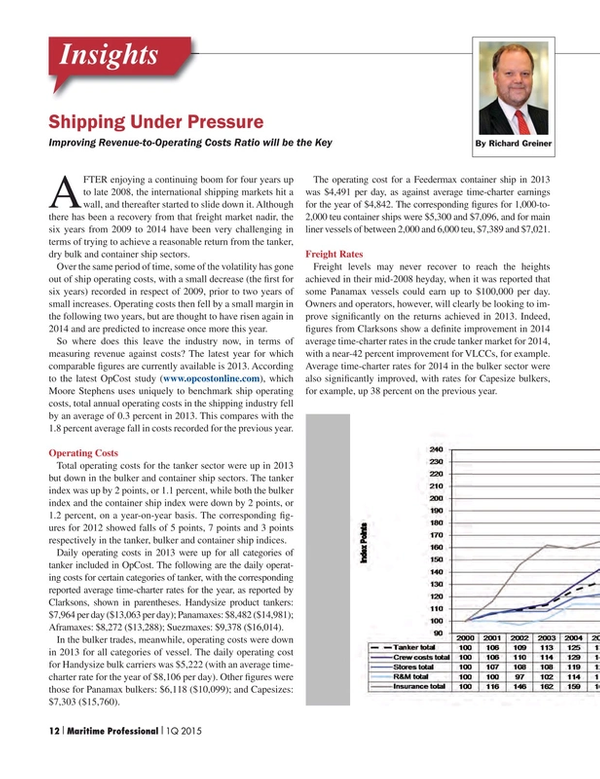
Over the same period of time, some of the volatility has gone out of ship operating costs, with a small decrease (the first for six years) recorded in respect of 2009, prior to two years of small increases. Operating costs then fell by a small margin in the following two years, but are thought to have risen again in 2014 and are predicted to increase once more this year.
So where does this leave the industry now, in terms of measuring revenue against costs? The latest year for which comparable figures are currently available is 2013. According to the latest OpCost study (www.opcostonline.com), which Moore Stephens uses uniquely to benchmark ship operating costs, total annual operating costs in the shipping industry fell by an average of 0.3 percent in 2013. This compares with the 1.8 percent average fall in costs recorded for the previous year.
Operating Costs
Total operating costs for the tanker sector were up in 2013 but down in the bulker and container ship sectors. The tanker index was up by 2 points, or 1.1 percent, while both the bulker index and the container ship index were down by 2 points, or 1.2 percent, on a year-on-year basis. The corresponding figures for 2012 showed falls of 5 points, 7 points and 3 points respectively in the tanker, bulker and container ship indices.
Daily operating costs in 2013 were up for all categories of tanker included in OpCost. The following are the daily operating costs for certain categories of tanker, with the corresponding reported average time-charter rates for the year, as reported by Clarksons, shown in parentheses. Handysize product tankers: $7,964 per day ($13,063 per day); Panamaxes: $8,482 ($14,981); Aframaxes: $8,272 ($13,288); Suezmaxes: $9,378 ($16,014).
In the bulker trades, meanwhile, operating costs were down in 2013 for all categories of vessel. The daily operating cost for Handysize bulk carriers was $5,222 (with an average time-charter rate for the year of $8,106 per day). Other figures were those for Panamax bulkers: $6,118 ($10,099); and Capesizes: $7,303 ($15,760).
The operating cost for a Feedermax container ship in 2013 was $4,491 per day, as against average time-charter earnings for the year of $4,842. The corresponding figures for 1,000-to-2,000 teu container ships were $5,300 and $7,096, and for main liner vessels of between 2,000 and 6,000 teu, $7,389 and $7,021.
Freight Rates
Freight levels may never recover to reach the heights achieved in their mid-2008 heyday, when it was reported that some Panamax vessels could earn up to $100,000 per day. Owners and operators, however, will clearly be looking to improve significantly on the returns achieved in 2013. Indeed, figures from Clarksons show a definite improvement in 2014 average time-charter rates in the crude tanker market for 2014, with a near-42 percent improvement for VLCCs, for example. Average time-charter rates for 2014 in the bulker sector were also significantly improved, with rates for Capesize bulkers, for example, up 38 percent on the previous year.
Some of the gloss may have come off those improved figures in the early part of this year, but the real taking point at the moment is the Baltic Dry Index which, having nudged towards 12,000 in mid-2008, was hovering at around 770 in January 2015 and, at the time of writing, was very close to an all-time low. The market is very volatile, and likely to remain so for some time. Confidence in the shipping industry was at its highest level for six years in first-quarter 2014. Sadly, however, it closed the year on a two-year low.
One needn’t be a rocket scientist, or even a naval architect, to appreciate that overtonnaging is a significant factor in depressing freight rates, which in turn impacts adversely on industry confidence. Despite increased scrapping, and despite the paucity of traditional bank finance, there are still too many ships on the market to carry the cargoes available. For as long as this is the case, freight rates will remain under pressure.
OpEx: Crew Costs in the Spotlight
So far as operating costs are concerned, it is instructive to see where the industry is spending its money. Once again, crew costs were the headline figure in 2013, when they were the only category of expenditure to show an increase over the 12-month period. This time it was a comparatively small rise for an industry which had seen increases of more than 20 percent at their peak. The fact that such costs were the only category to show an increase for 2013 is perhaps a reflection of a diminution in the number of owners and operators exiting the industry and a reminder that investment in good people is a must.
There was a 0.2 percent overall average rise in 2013 crew costs compared to the 2012 figure. By way of comparison, OpCost revealed a 21 percent increase in this category in 2008. Tankers overall experienced an increase in crew costs in 2013 of 1.8 percent on average, compared to the 2.3 percent fall recorded in 2012. Within the tanker sector, Handysize product tankers reported an overall increase of 3.3 percent in crew costs, while for operators of Suezmaxes and product tankers the increases were 2.5 percent and 1.9 percent respectively. The only tanker category to show a fall in crew costs was VLCCs, down by 0.9 percent.
For bulkers, the overall average fall in crew costs was 0.5 percent, the same as in the previous year. The operators of Panamax bulkers paid 2.3 percent less in crew costs than in 2012, but there was a 1.2 percent increase in this respect for Handysize bulkers, this following a 4.8 percent reduction for 2012. Expenditure on crew costs remained unchanged over the 12 month period in the container ship sector, although operators of vessels of between 100 and 1,000 teu did record a 1.7 percent increase in such costs for 2013.
All Costs, at a glance ...
Expenditure on stores was down this time by 1.9 percent overall, compared to the fall of 2.1 percent in 2012. The biggest fall in such costs was the 5.5 percent recorded by VLCCs. For bulk carriers overall, stores costs fell by an average of 4.1 percent, while in the tanker and container ship sectors the overall reductions in costs were 2.1 percent and 3.4 percent respectively. The most significant increase in stores expenditure was that recorded by the operators of tankers in the 5,000-to-10,000 dwt range (6.0 percent).
There was an overall fall in repairs and maintenance costs of 0.4 percent, compared to the 1.9 percent reduction recorded for 2012. The most significant cost reduction here was that recorded for bulkers of between 10,000 and 20,000 dwt (7.2 percent), while the highest recorded increase was that for 40,000-to-50,000 dwt chemical tankers (3.6 percent). This reduced expenditure on repairs and maintenance is the sort of development one would expect to see at a difficult time for any industry, but one which will hopefully not mean that owners and operators will stop pursuing the sort of sound husbandry which competition and regulation demand.
The overall drop in costs of 0.3 percent recorded in respect of insurance compares to the 6.2 percent fall recorded for 2012, and was the lowest in this category for a number of years. The operators of all categories of bulkers paid less for their insurance in 2013 than they did in 2012, in the case of Handysize bulkers to the tune of 4.1 percent. In the tanker category, all but two types of vessel – 5,000-to-10,000 dwt tankers and Handysize product tankers – paid less than in 2012, while operators of 100-to-1,000 teu container ships paid 2.7 percent more in 2013 than in 2012. The fall in insurance costs in 2013 is significantly down on that for the previous year, suggesting that underwriters in the hull market are taking a harder line.
Crystal Ball
Looking ahead, vessel operating costs are thought likely to have risen by almost three percent in 2014, and are predicted to rise by the same margin in 2015, according to the Moore Stephens Future Operating Costs survey. Crew wages and repairs & maintenance are the cost categories deemed likely to increase most significantly, the former by 2.4 percent in 2014 and by 2.6 percent in 2015.
P&I insurance costs are expected to go up by 2.0 percent in 2014 and by 2.2 percent in 2015, this compared to the increases of 1.6 and 1.8 percent respectively predicted in respect of the cost of hull & machinery insurance. Drydocking costs are expected to rise by 2.1 percent in 2014 and by 2.2 percent in 2015, while expenditure on spares is expected to increase by 2.1 percent and by 2.2 percent over the same period. Increases of 1.7 percent and 2.0 percent respectively are also anticipated in the cost of lubricants in the two years under review. The cost of stores is expected to increase by 1.7 percent and 1.9 percent respectively for 2014 and 2015.
The three factors considered most likely to influence the level of vessel operating costs over the next 12 months were finance costs (20 percent), followed closely by competition (19 percent). Crew supply (18 percent) was in third place, followed by demand trends (17 percent) and labour costs (13 percent). Lastly, the cost of raw materials was cited by 11 percent of respondents as a factor that would account for an increase in operating costs.
Management fees were deemed likely to produce the lowest level of increases in both 2014 and 2015. There are those who argue that outsourcing management to an external provider can help to reduce operating costs. There is no definitive answer to this question. All that can be said with any certainty is that, the greater the number of services which are outsourced, the greater the amount of due diligence required.
In 2008, overall operating costs rose by 16 percent, so the level of increases anticipated for 2014 and 2015 are unlikely to panic serious industry players. But the cost of existing and impending regulation is a major cause for concern. Sulphur emissions regulations will encourage the development of more eco-friendly tonnage, but they come at a hefty price. Even that, however, may be small beer compared to achieving compliance with the BWT convention which is now very close to ratification.
Sensible owners with adequate funding are planning for the future by investing in eco-friendly ships and by weighing up the advantages of LNG propulsion. Such initiatives will bring long-term benefits but are likely to increase costs in the short term because new technology and associated research and development costs do not come cheap. On the plus side, oil and gas prices are falling, which should translate into savings for owners and operators.
Meanwhile, shipping continues to attract new money from both internal and external investors. Over the past twelve months or so we have started to see some of the banks rediscover their appetite for shipping. They are now re-entering a much-changed ship finance market, one in which private equity has invested significant amounts over the past two years, and is likely to invest more in the next couple. This is stake money that shipping, with a mortgage to pay and engines to feed, badly needs.
In summary, the projected increases in vessel operating costs for the next two years will be difficult for owners, operators and managers to absorb. The industry remains under pressure to manage and reduce such costs wherever possible, whilst making suitable budgetary provision for achieving forthcoming regulatory compliance. Revenues earned in the freight markets must ultimately be sufficient not only to cover operating costs but also to generate a reasonable return on investment, and shipping will need all the resilience and inventiveness at its disposal to improve net operating cashflow.
(As published in the 1Q 2015 edition of Maritime Professional - www.maritimeprofessional.com)
Read Shipping Under Pressure in Pdf, Flash or Html5 edition of Q1 2015 Maritime Logistics Professional
Other stories from Q1 2015 issue
Content
- Managing the Human Element page: 8
- Middle Market Mergers and Acquisitions: A Primer page: 10
- Shipping Under Pressure page: 12
- Ethane Transport & Technology page: 16
- No Risk in a Curious Career Path page: 20
- The Human Element of Ship Management page: 32
- Stepping Up for the Mariner page: 40
- When It Comes to Professional Recruitment: EXPERIENCE PAYS page: 44
- Accelerating the Excelerate LNG Business Model page: 46
- Ship Management and Technology page: 50
- Salvage 101: The Importance of Cooperation page: 54
- Cruise Port Business Redefined page: 58