Page 44: of Marine News Magazine (June 2006)
Fourth Annual "Geo Six Pack"
Read this page in Pdf, Flash or Html5 edition of June 2006 Marine News Magazine
 43
43
 45
45
lars in public and private investment in plant and equipment. This investment creates and maintains positive economic growth and sustains family-wage jobs.
The river system is a critical energy sup- ply line, a facilitator of exports, and an environmentally superior mode of trans- port. For every dollar of investment in waterways priority projects, between $7 and $13 is returned in transportation ben- efits to the United States.
In 2004 more than 607 million tons of "building block" commodities moved on
America's inland navigational system.
These commodities keep America strong and feed the world. Interestingly, though, in a $765b U.S. transportation market- with 87.7 percent of that spent on the trucking industry-with only 1 percent of the total transportation dollars is spent on water transportation, even though we move 16.5 percent of the total commodi- ties. Our industry - and waterborne trans- portation - is generally out of sight, out of mind. But the inland waterways trans- portation system is truly what binds us together in this country and allows us to turn on a light, eat our cereal in the morn- ing, and drive our car to work. It deserves our support and our commitment to nur- ture it, not neglect it.
Waterways Council, Inc. is the national public policy organization advocating a modern and well-maintained national sys- tem of ports and inland waterways. The group is supported by more than 250 waterways carriers, shippers, port author- ities, shipping associations and waterways advocacy groups from all regions of the country. 44 • MarineNews • June 2006
BARGE 450-6 7,132 16,460 1981 2006 SH
BARGE 450-7 7,132 16,460 1981 2006 SH
BARGE 450-8 7,132 16,460 1981 2006 SH
BARGE 450-10 7,132 16,460 1981 2006 SH
FLORIDA BAY 12,271 20,866 1981 2006 SH
OCEAN 210 11,951 22,562 1981 2006 SH
KTC 80 5,264 11,000 1981 2006 SH
TEXAS 7,244 15,014 1981 2006 SH
BARGE 450-11 7,132 16,460 1982 2007 SH
OCEAN 211 11,012 22,562 1982 2007 SH
PENN NO. 400 5,651 10,228 1977 2007 DB
RTC 503 9,185 16,330 1982 2007 SH
SOUTH CAROLINA BAY 12,399 20,866 1982 2007 SH
VIRGINIA BAY 12,271 20,866 1982 2007 SH
B NO 185 8,371 18,944 1987 2009 SH
B NO 195 8,371 18,944 1989 2009 SH
ENERGY 11101 6,925 15,405 1979 2009 DB
ENERGY 11102 6,925 15,535 1979 2009 DB
PENN NO. 410 5,293 10,252 1979 2009 DB
BISCAYNE 5,407 10,925 1981 2011 DB
B NO 35 4,761 11,632 1980 2014 SH
ENERGY 7002 4,362 10,693 1971 2014 SH
HUGH 4,397 10,251 1977 2014 SH
KLAMATH 4,412 10,070 1990 2014 SH
B NO 80 4,089 12,313 1981 2014 SH
B NO 85 4,038 11,693 1971 2014 SH
B NO 95 4,981 11,693 1972 2014 SH
B NO 105 4,981 11,693 1971 2014 SH
RTC 105 4,892 11,716 1980 2014 SH
RTC 90 4,982 11,792 1980 2014 SH
WESTCHESTER 4,179 10,510 1975 2014 SH
ACADIA 10,554 20,041 1997 na DH
ALSEA BAY 6,039 11,703 2003 na DH
ATC 21 9,439 19,500 2002 na DH
ATC 23 10,554 29,938 1978 na DH
ATLANTIC 8,327 17,068 1995 na DH
BARGE 550-1 11,457 19,999 2002 na DH
BARGE 550-2 11,457 19,999 2002 na DH
BARGE 550-3 11,457 19,999 2002 na DH
BARGE 550-4 11,457 19,999 2002 na DH
B NO 210 8,225 13,504 1995 na DH
B NO 215 8,721 17,277 1999 na DH
B NO 220 8,225 13,504 1999 na DH
B NO 225 8,799 18,870 2003 na DH
B NO 230 10,658 18,944 1993 na DH
B NO 235 10,722 17,892 1995 na DH
B NO 240 10,483 18,136 1994 na DH
B NO 242 11,089 22,658 2004 na DH
B NO 245 19,049 26,309 1997 na DH
B NO 255 11,854 18,944 1979 na DH
B NO 265 11,854 18,944 1979 2002 na DH
B NO 275 11,854 18,944 1981 2004 na DH
CARIBBEAN 8,327 17,034 1995 na DH
CASABLANCA 7,001 12,247 1987 na DH
CAPELLLA 5,790 10,854 2002 na DH
COMMENCEMENT BAY 6,040 11,703 2003 na DH
DBL 70 5,248 10,277 1972 na DH
DBL 78 5,559 12,579 2000 na DH
DBL 81 5,896 15,854 2002 na DH
DBL 82 5,896 15,854 2003 na DH
DBL 101 7,159 15,852 2002 na DH
DBL 102 7,159 15,852 2003 na DH
DBL 103 7,132 14,215 2005 na DH
DBL 105 8,505 16,574 1982 2003 na DH
DBL 134 9,514 18,742 1986 1994 na DH
DBL 140 10,303 20,313 1999 na DH
DBL 151 9,741 19,995 1981 na DH
DBL 152 9,741 19,995 1982 na DH
DBL 155 11,962 19,984 1974 2004 na DH
EVERGLADES 15,126 24,800 1980 2000 na DH
ENERGY 11103 8,343 18,512 2005 na DH
ENERGY 11104 8,268 18,572 2005 na DH
ENERGY 13501 9,787 20,000 2005 na DH
ENERGY 13502 9,787 20,000 2005 na DH
ENERGY 8001 5,752 10,531 1996 na DH
GEORGIA 8,460 18,437 2005 na DH
HILO BAY 5,058 10,614 2004 na DH
KEY WEST 10,256 21,500 2004 na DH
LEMON CREEK 7,001 13,608 1987 na DH
LEO 5,954 10,891 2003 na DH
M 192 11,796 19,958 1979 1998 na DH
M 214 14,480 20,629 1975 2004 na DH
M 244 16,021 26,853 1971 2000 na DH
M 252 16,928 27,730 1972 2002 na DH
M 254 16,972 27,888 1970 2002 na DH
M 300 16,553 37,507 1979 na DH
MARITRANS 400 27,471 59,430 1981 na DH
MASSACHUSETTS 10,736 21,246 1982 na DH
NEW HAMPSHIRE 8,460 18,542 2004 na DH
NOA 4,826 10,614 2002 na DH
PENN NO. 90 7,592 15,000 2002 na DH
PENN NO. 120 9,424 18,000 2002 na DH
PENN NO. 121 9,424 18,000 2003 na DH
PORTLAND 6,917 12,969 1987 na DH
POSEIDON 6,744 15,241 1973 na DH
RTC 100 7,311 14,382 2005 na DH
RTC 101 7,311 14,382 2005 na DH
RTC 135 10,077 21,440 1999 na DH
RTC 145 10,460 22,545 2002 na DH
RTC 150 10,460 22,545 2003 na DH
RIGEL 5,669 12,249 1993 na DH
SANSANOA 5,790 12,467 2001 na DH
SPRING CREEK 7,001 13,608 1987 na DH
SUNSET BAY 7,552 11,900 2004 na DH
TENNESSEE 5,688 12,319 2003 na DH
THE PATRIOT 5,826 10.433 2004 na DH
TMI 17 6,840 15,876 1996 na DH
YUCATAN 11,432 21,146 1998 na DH
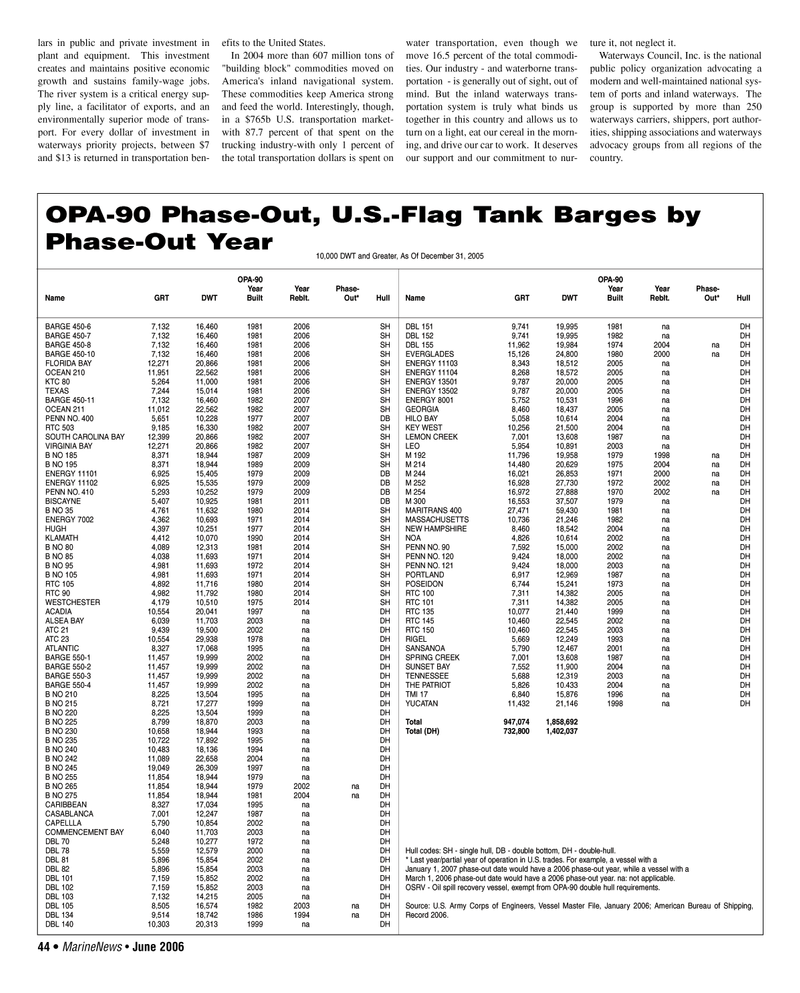
Total 947,074 1,858,692
Total (DH) 732,800 1,402,037
Hull codes: SH - single hull, DB - double bottom, DH - double-hull. * Last year/partial year of operation in U.S. trades. For example, a vessel with a
January 1, 2007 phase-out date would have a 2006 phase-out year, while a vessel with a
March 1, 2006 phase-out date would have a 2006 phase-out year. na: not applicable.
OSRV - Oil spill recovery vessel, exempt from OPA-90 double hull requirements.
Source: U.S. Army Corps of Engineers, Vessel Master File, January 2006; American Bureau of Shipping,
Record 2006.
OPA-90 Phase-Out, U.S.-Flag Tank Barges by
Phase-Out Year 10,000 DWT and Greater, As Of December 31, 2005
OPA-90
Year Year Phase-
Name GRT DWT Built Reblt. Out* Hull
OPA-90
Year Year Phase-
Name GRT DWT Built Reblt. Out* Hull
JUNE MN2006 6(41-48).qxd 6/2/2006 4:20 PM Page 44