
Page 8: of Marine News Magazine (November 2012)
Workboat Annual
Read this page in Pdf, Flash or Html5 edition of November 2012 Marine News Magazine
 7
7
 9
9
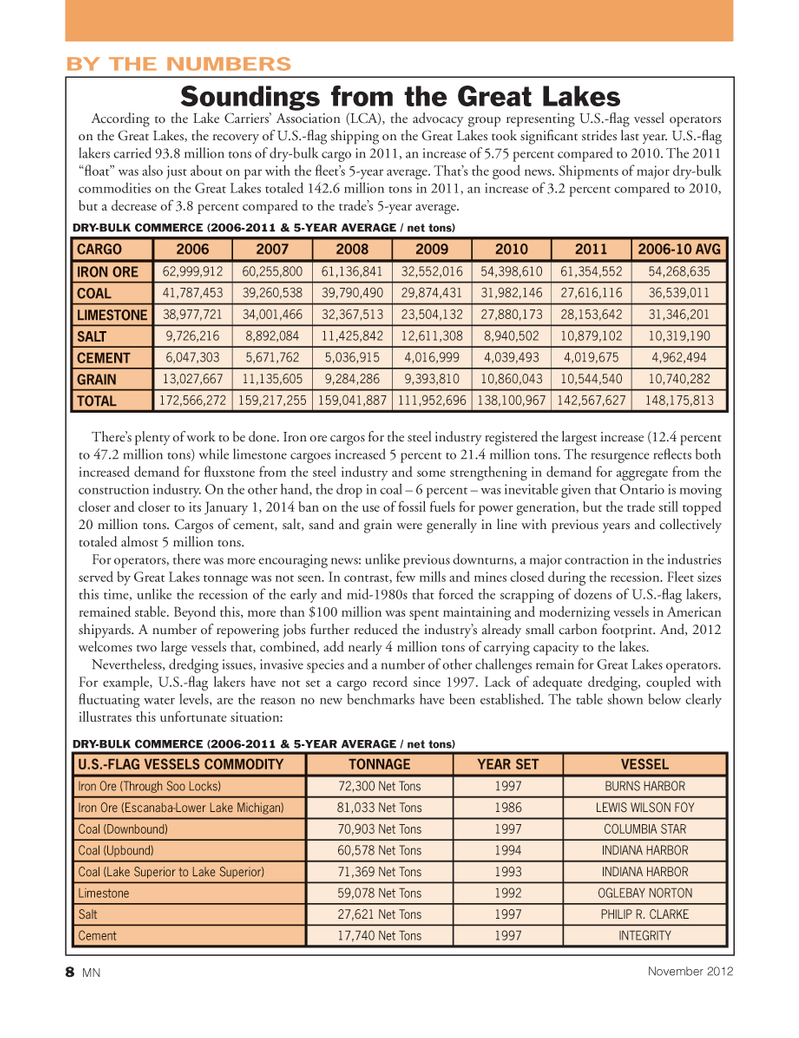
According to the Lake Carriers? Association (LCA), the advocacy group representing U.S.- ag vessel operators on the Great Lakes, the recovery of U.S.- ag shipping on the Great Lakes took signi cant strides last year. U.S.- ag lakers carried 93.8 million tons of dry-bulk cargo in 2011, an increase of 5.75 percent compared to 2010. The 2011 ? oat? was also just about on par with the eet?s 5-year average. That?s the good news. Shipments of major dry-bulk commodities on the Great Lakes totaled 142.6 million tons in 2011, an increase of 3.2 percent compared to 2010, but a decrease of 3.8 percent compared to the trade?s 5-year average. DRY-BULK COMMERCE (2006-2011 & 5-YEAR AVERAGE / net tons) There?s plenty of work to be done. Iron ore cargos for the steel industry registered the largest increase (12.4 percent to 47.2 million tons) while limestone cargoes increased 5 percent to 21.4 million tons. The resurgence re ects both increased demand for uxstone from the steel industry and some strengthening in demand for aggregate from the construction industry. On the other hand, the drop in coal ? 6 percent ? was inevitable given that Ontario is moving closer and closer to its January 1, 2014 ban on the use of fossil fuels for power generation, but the trade still topped 20 million tons. Cargos of cement, salt, sand and grain were generally in line with previous years and collectively totaled almost 5 million tons.For operators, there was more encouraging news: unlike previous downturns, a major contraction in the industries served by Great Lakes tonnage was not seen. In contrast, few mills and mines closed during the recession. Fleet sizes this time, unlike the recession of the early and mid-1980s that forced the scrapping of dozens of U.S.- ag lakers, remained stable. Beyond this, more than $100 million was spent maintaining and modernizing vessels in American shipyards. A number of repowering jobs further reduced the industry?s already small carbon footprint. And, 2012 welcomes two large vessels that, combined, add nearly 4 million tons of carrying capacity to the lakes. Nevertheless, dredging issues, invasive species and a number of other challenges remain for Great Lakes operators. For example, U.S.- ag lakers have not set a cargo record since 1997. Lack of adequate dredging, coupled with uctuating water levels, are the reason no new benchmarks have been established. The table shown below clearly illustrates this unfortunate situation: DRY-BULK COMMERCE (2006-2011 & 5-YEAR AVERAGE / net tons) BY THE NUMBERSSoundings from the Great Lakes CARGO 2006200720082009201020112006-10 AVG IRON ORE 62,999,91260,255,800 61,136,84132,552,01654,398,61061,354,55254,268,635 COAL 41,787,45339,260,538 39,790,49029,874,43131,982,14627,616,11636,539,011 LIMESTONE 38,977,72134,001,466 32,367,51323,504,13227,880,17328,153,64231,346,201 SALT 9,726,2168,892,084 11,425,84212,611,3088,940,50210,879,10210,319,190 CEMENT6,047,3035,671,762 5,036,9154,016,9994,039,4934,019,6754,962,494 GRAIN 13,027,66711,135,605 9,284,2869,393,81010,860,04310,544,54010,740,282 TOTAL 172,566,272159,217,255159,041,887111,952,696138,100,967142,567,627148,175,813 U.S.-FLAG VESSELS COMMODITY TONNAGE YEAR SETVESSELIron Ore (Through Soo Locks) 72,300 Net Tons 1997BURNS HARBORIron Ore (Escanaba-Lower Lake Michigan)81,033 Net Tons 1986LEWIS WILSON FOYCoal (Downbound) 70,903 Net Tons 1997COLUMBIA STAR Coal (Upbound) 60,578 Net Tons 1994INDIANA HARBORCoal (Lake Superior to Lake Superior) 71,369 Net Tons 1993INDIANA HARBORLimestone 59,078 Net Tons 1992OGLEBAY NORTON Salt 27,621 Net Tons 1997PHILIP R. CLARKECement 17,740 Net Tons 1997INTEGRITY8 MNNovember 2012MNNov2012 Layout 1-17.indd 8MNNov2012 Layout 1-17.indd 811/7/2012 11:27:55 AM11/7/2012 11:27:55 AM