
Page 8: of Marine News Magazine (February 2013)
Bulk Transport Leadership Roundtable
Read this page in Pdf, Flash or Html5 edition of February 2013 Marine News Magazine
 7
7
 9
9
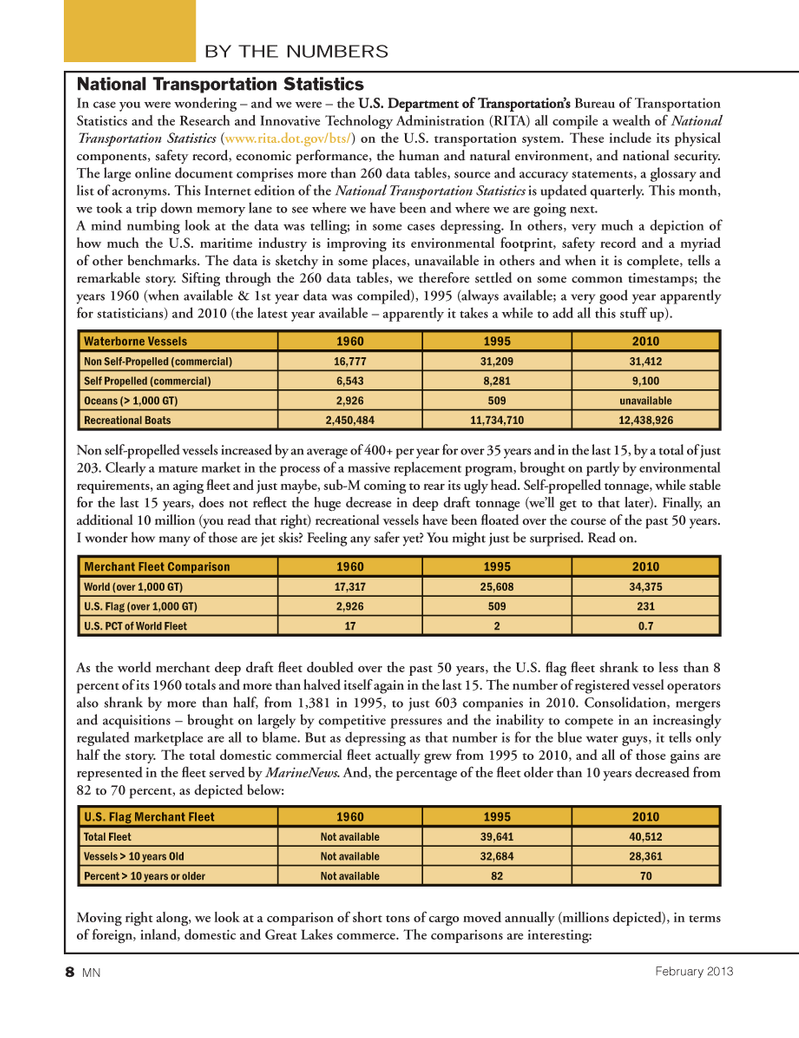
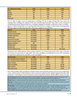
National Transportation Statistics In case you were wondering ? and we were ? the U.S. Department of Transportation?s U.S. Department of Transportation?s Bureau of Transportation Statistics and the Research and Innovative Technology Administration (RITA) all compile a wealth of National Transportation Statistics (www.rita.dot.gov/bts/ ) on the U.S. transportation system. These include its physical components, safety record, economic performance, the human and natural environment, and national security. The large online document comprises more than 260 data tables, source and accuracy statements, a glossary and list of acronyms. This Internet edition of the National Transportation Statistics is updated quarterly. This month, we took a trip down memory lane to see where we have been and where we are going next. A mind numbing look at the data was telling; in some cases depressing. In others, very much a depiction of how much the U.S. maritime industry is improving its environmental footprint, safety record and a myriad of other benchmarks. The data is sketchy in some places, unavailable in others and when it is complete, tells a remarkable story. Sifting through the 260 data tables, we therefore settled on some common timestamps; the years 1960 (when available & 1st year data was compiled), 1995 (always available; a very good year apparently for statisticians) and 2010 (the latest year available ? apparently it takes a while to add all this stuff up). Non self-propelled vessels increased by an average of 400+ per year for over 35 years and in the last 15, by a total of just 203. Clearly a mature market in the process of a massive replacement program, brought on partly by environmental requirements, an aging eet and just maybe, sub-M coming to rear its ugly head. Self-propelled tonnage, while stable for the last 15 years, does not re ect the huge decrease in deep draft tonnage (we?ll get to that later). Finally, an additional 10 million (you read that right) recreational vessels have been oated over the course of the past 50 years. I wonder how many of those are jet skis? Feeling any safer yet? You might just be surprised. Read on. As the world merchant deep draft eet doubled over the past 50 years, the U.S. ag eet shrank to less than 8 percent of its 1960 totals and more than halved itself again in the last 15. The number of registered vessel operators also shrank by more than half, from 1,381 in 1995, to just 603 companies in 2010. Consolidation, mergers and acquisitions ? brought on largely by competitive pressures and the inability to compete in an increasingly regulated marketplace are all to blame. But as depressing as that number is for the blue water guys, it tells only half the story. The total domestic commercial eet actually grew from 1995 to 2010, and all of those gains are represented in the eet served by MarineNews . And, the percentage of the eet older than 10 years decreased from 82 to 70 percent, as depicted below: Moving right along, we look at a comparison of short tons of cargo moved annually (millions depicted), in terms of foreign, inland, domestic and Great Lakes commerce. The comparisons are interesting: Waterborne Vessels 1960 1995 2010 Non Self-Propelled (commercial) 16,777 31,209 31,412 Self Propelled (commercial) 6,543 8,281 9,100 Oceans (> 1,000 GT) 2,926509unavailable Recreational Boats 2,450,484 11,734,710 12,438,926Merchant Fleet Comparison 1960 1995 2010 World (over 1,000 GT) 17,317 25,60834,375 U.S. Flag (over 1,000 GT) 2,926509231 U.S. PCT of World Fleet 17 20.7U.S. Flag Merchant Fleet 1960 1995 2010 Total Fleet Not available 39,641 40,512 Vessels > 10 years Old Not available 32,684 28,361 Percent > 10 years or older Not available 8270BY THE NUMBERS8 MNFebruary 2013 MN Feb2013 Layout 1-17.indd 8MN Feb2013 Layout 1-17.indd 82/1/2013 12:24:01 PM2/1/2013 12:24:01 PM