
Page 10: of Marine News Magazine (March 2014)
Fleet & Vessel Optimization
Read this page in Pdf, Flash or Html5 edition of March 2014 Marine News Magazine
 9
9
 11
11
happened on the water and only 17 attributable to passenger vessel ac- cidents. That fi gure decreased even more in 2011 (Figure 2.). Finally, the Coast Guard also asserts that the majority of fatalities ( 83%) were not related to operation of a vessel but rather resulted from diving acci- dents, swimming, snorkeling or nat- ural causes. These non-vessel-related fatalities, says the Coast Guard, stem from unregulated activities.
Based on these numbers, it’s a curi- ous thing that the NTSB would tar- get passenger vessels when it is clear that there are bigger problems else- where. For example – and echoing a previous report made is these pages (October 2013) – the Coast Guard in 1988 implemented chemical test- ing to discourage drug and alcohol use by vessel personnel and enhance safety. A recent study gauged the effectiveness of this chemical test- ing. Post-Accident drug and alcohol test results of crewmembers from two vessel categories – minimally regulated commercial fi shing vessels (CFVs) with no chemical testing re- quirements except for Post-Accident drugs and alcohol and the other, highly regulated small passenger ves- sels (SPVs) of 100 tons or less with comprehensive chemical testing re- quirements – were compared. The drug test results that marine employ- ers submit to the Coast Guard were also compared.
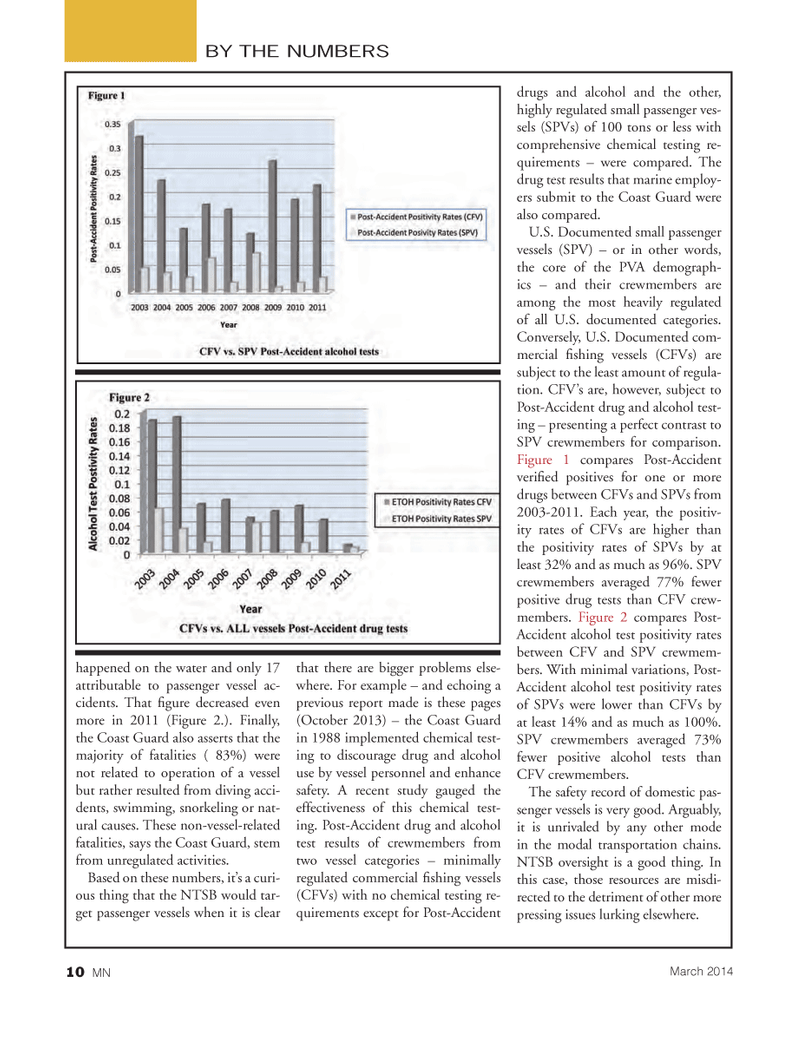
U.S. Documented small passenger vessels (SPV) – or in other words, the core of the PVA demograph- ics – and their crewmembers are among the most heavily regulated of all U.S. documented categories.
Conversely, U.S. Documented com- mercial fi shing vessels (CFVs) are subject to the least amount of regula- tion. CFV’s are, however, subject to
Post-Accident drug and alcohol test- ing – presenting a perfect contrast to
SPV crewmembers for comparison.
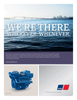
Figure 1 compares Post-Accident verifi ed positives for one or more drugs between CFVs and SPVs from 2003-2011. Each year, the positiv- ity rates of CFVs are higher than the positivity rates of SPVs by at least 32% and as much as 96%. SPV crewmembers averaged 77% fewer positive drug tests than CFV crew- members. Figure 2 compares Post-
Accident alcohol test positivity rates between CFV and SPV crewmem- bers. With minimal variations, Post-
Accident alcohol test positivity rates of SPVs were lower than CFVs by at least 14% and as much as 100%.
SPV crewmembers averaged 73% fewer positive alcohol tests than
CFV crewmembers.
The safety record of domestic pas- senger vessels is very good. Arguably, it is unrivaled by any other mode in the modal transportation chains.
NTSB oversight is a good thing. In this case, those resources are misdi- rected to the detriment of other more pressing issues lurking elsewhere.
BY THE NUMBERS
March 2014 10 MN
MN MAR14 Layout 1-17.indd 10 2/21/2014 3:16:43 PM