
Page 8: of Marine News Magazine (June 2014)
Dredging & Marine Construction
Read this page in Pdf, Flash or Html5 edition of June 2014 Marine News Magazine
 7
7
 9
9
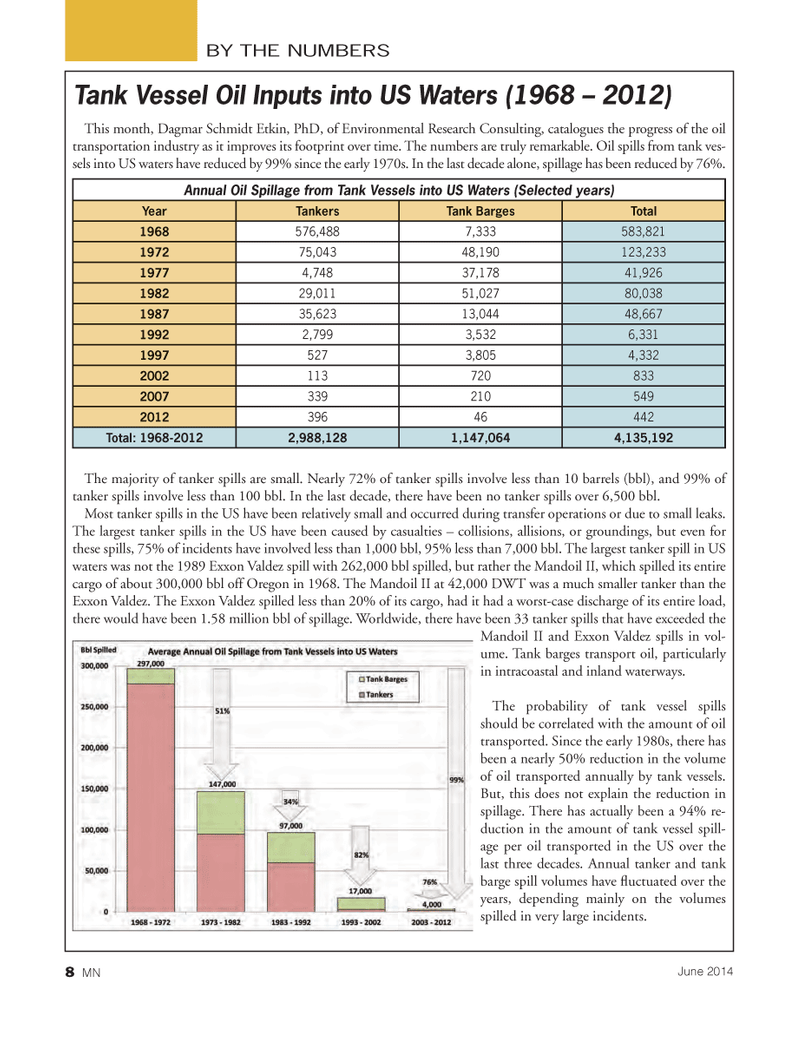
BY THE NUMBERSThis month, Dagmar Schmidt Etkin, PhD, of Environmental Research Consulting, catalogues the progress of the oil transportation industry as it improves its footprint over time. The numbers are truly remarkable. Oil spills from tank ves- sels into US waters have reduced by 99% since the early 1970s. In the last decade alone, spillage has been reduced by 76%. The majority of tanker spills are small. Nearly 72% of tanker spills involve less than 10 barrels (bbl), and 99% of tanker spills involve less than 100 bbl. In the last decade, there have been no tanker spills over 6,500 bbl. Most tanker spills in the US have been relatively small and occurred during transfer operations or due to small leaks. The largest tanker spills in the US have been caused by casualties ? collisions, allisions, or groundings, but even for these spills, 75% of incidents have involved less than 1,000 bbl, 95% less than 7,000 bbl. The largest tanker spill in US waters was not the 1989 Exxon Valdez spill with 262,000 bbl spilled, but rather the Mandoil II, which spilled its entire cargo of about 300,000 bbl off Oregon in 1968. The Mandoil II at 42,000 DWT was a much smaller tanker than the Exxon Valdez. The Exxon Valdez spilled less than 20% of its cargo, had it had a worst-case discharge of its entire load, there would have been 1.58 million bbl of spillage. Worldwide, there have been 33 tanker spills that have exceeded the Mandoil II and Exxon Valdez spills in vol- ume. Tank barges transport oil, particularly in intracoastal and inland waterways. The probability of tank vessel spills should be correlated with the amount of oil transported. Since the early 1980s, there has been a nearly 50% reduction in the volume of oil transported annually by tank vessels. But, this does not explain the reduction in spillage. There has actually been a 94% re- duction in the amount of tank vessel spill- age per oil transported in the US over the last three decades. Annual tanker and tank barge spill volumes have uctuated over the years, depending mainly on the volumes spilled in very large incidents. Tank Vessel Oil Inputs into US Waters (1968 ? 2012) Annual Oil Spillage from Tank Vessels into US Waters (Selected years) Year Tankers Tank Barges Total 1968576,4887,333583,821197275,04348,190123,23319774,74837,17841,926198229,01151,02780,038198735,62313,04448,66719922,7993,5326,33119975273,8054,33220021137208332007339210549201239646442Total: 1968-2012 2,988,1281,147,0644,135,1928 MNJune 2014MN June14 Layout 1-17.indd 8MN June14 Layout 1-17.indd 85/20/2014 11:56:49 AM5/20/2014 11:56:49 AM