
Page 10: of Marine News Magazine (September 2014)
Inland Waterways
Read this page in Pdf, Flash or Html5 edition of September 2014 Marine News Magazine
 9
9
 11
11
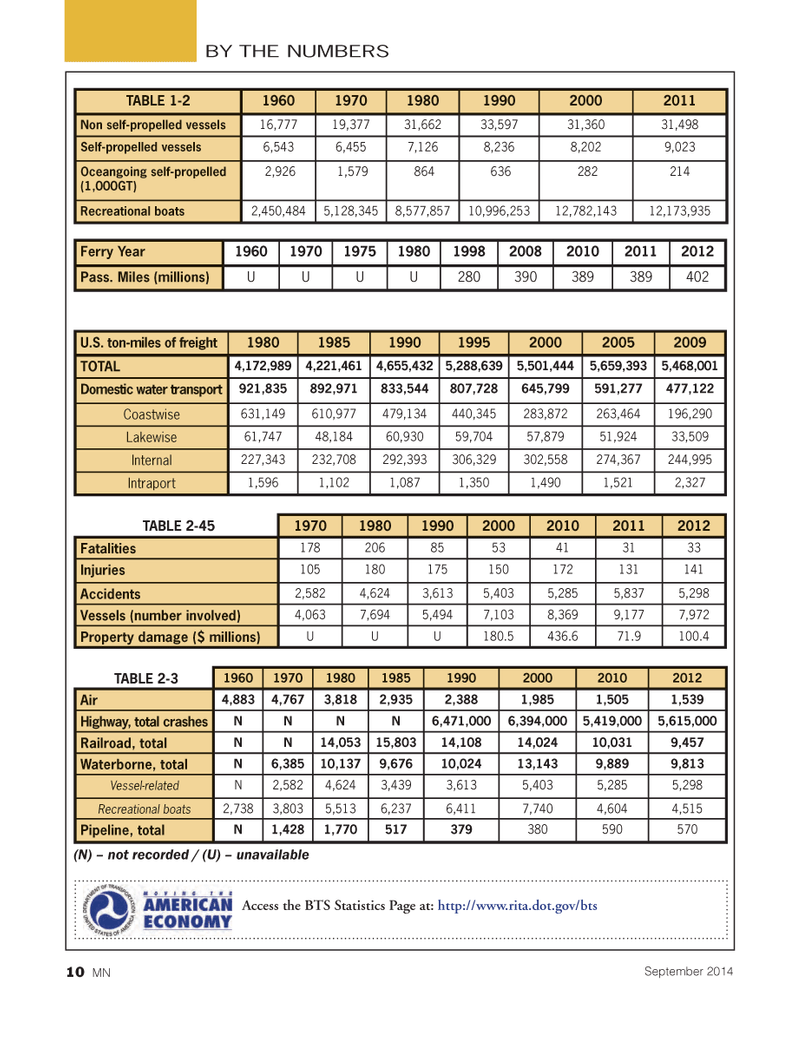
BY THE NUMBERSAccess the BTS Statistics Page at: http://www.rita.dot.gov/bts U.S. ton-miles of freight 1980198519901995200020052009 TOTAL 4,172,9894,221,4614,655,4325,288,6395,501,4445,659,3935,468,001 Domestic water transport 921,835892,971833,544807,728645,799591,277477,122 Coastwise631,149610,977479,134440,345283,872263,464196,290 Lakewise61,74748,18460,93059,70457,87951,92433,509 Internal227,343232,708292,393306,329302,558274,367244,995 Intraport 1,5961,1021,0871,3501,4901,5212,327 TABLE 2-45 1970198019902000201020112012 Fatalities1782068553413133 Injuries105180175150172131141 Accidents2,5824,6243,6135,4035,2855,8375,298 Vessels (number involved) 4,0637,6945,4947,1038,3699,1777,972 Property damage ($ millions) UUU180.5436.671.9100.4 TABLE 2-3 19601970198019851990200020102012 Air4,8834,7673,8182,9352,3881,9851,5051,539 Highway, total crashes NNNN6,471,0006,394,0005,419,0005,615,000 Railroad, total NN14,05315,80314,10814,02410,0319,457 Waterborne, total N6,38510,1379,67610,02413,1439,8899,813 Vessel-related N2,5824,6243,4393,6135,4035,2855,298 Recreational boats 2,7383,8035,5136,2376,4117,7404,6044,515 Pipeline, totalN1,4281,770517379 380590570 (N) ? not recorded / (U) ? unavailable Ferry Year 196019701975198019982008201020112012 Pass. Miles (millions)UUUU280390389389402 TABLE 1-2 196019701980199020002011 Non self-propelled vessels 16,77719,37731,66233,59731,36031,498 Self-propelled vessels 6,5436,4557,1268,2368,2029,023 Oceangoing self-propelled (1,000GT) 2,926 1,579 864 636 282214 Recreational boats 2,450,4845,128,3458,577,85710,996,25312,782,14312,173,935 September 201410 MNMN Sept14 Layout 1-17.indd 10MN Sept14 Layout 1-17.indd 108/21/2014 9:28:59 AM8/21/2014 9:28:59 AM