Page 8: of Marine News Magazine (January 2015)
Passenger Vessels & Ferries
Read this page in Pdf, Flash or Html5 edition of January 2015 Marine News Magazine
BY THE NUMBERS
Ferries: Numbers, Safety, and more.
The 2014 National Census of Ferry Operators is all but numbers. It’s about safety, too. And, North America is just done, with statistics due out in the ? rst quarter of 2015. one of many, diverse and varied ferry markets around the
On a biennial basis, the Research and Innovative Tech- globe. Separately, Roberta Weisbrod, Executive Director nology Administration’s (RITA’s) Bureau of Transporta- Worldwide Ferry Safety Association (WFSA) – who also tion Statistics (BTS) conducts a census of all ferry op- has another article within these pages – maintains very erators operating in the United States and its territories. well prepared statistics on her website (www.ferrysafety.
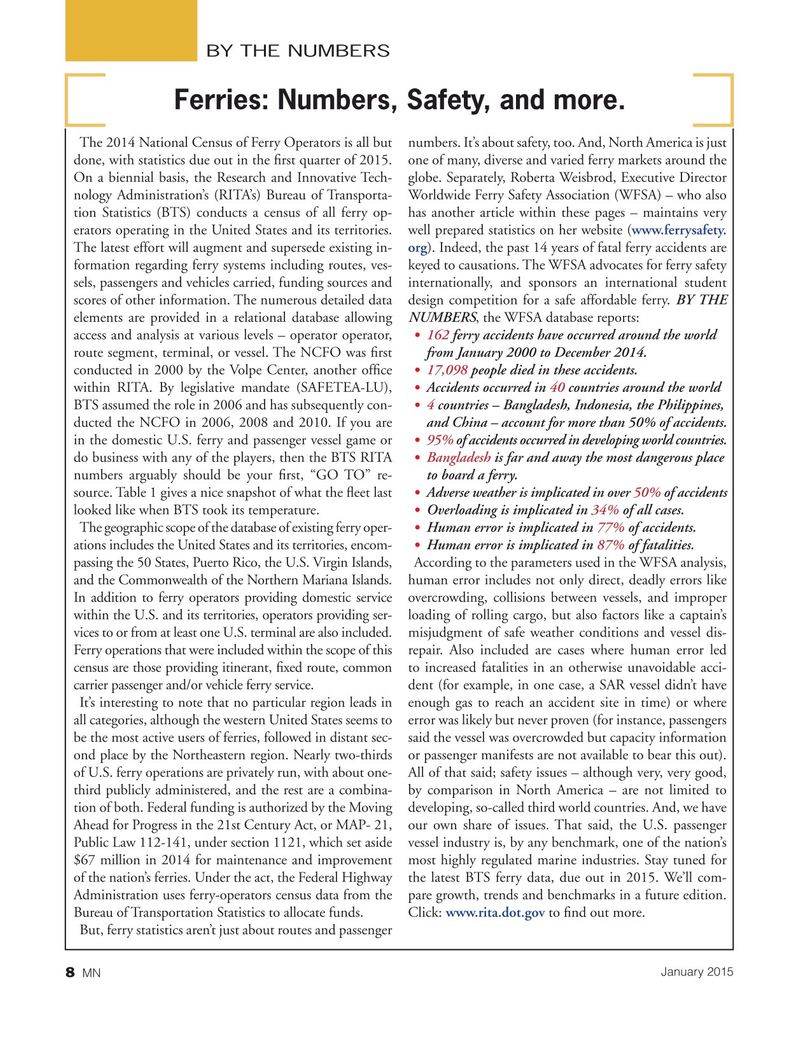
The latest effort will augment and supersede existing in- org). Indeed, the past 14 years of fatal ferry accidents are formation regarding ferry systems including routes, ves- keyed to causations. The WFSA advocates for ferry safety sels, passengers and vehicles carried, funding sources and internationally, and sponsors an international student scores of other information. The numerous detailed data design competition for a safe affordable ferry. BY THE elements are provided in a relational database allowing NUMBERS, the WFSA database reports: access and analysis at various levels – operator operator, 162 ferry accidents have occurred around the world • route segment, terminal, or vessel. The NCFO was ? rst from January 2000 to December 2014. conducted in 2000 by the Volpe Center, another of? ce 17,098 people died in these accidents.
• within RITA. By legislative mandate (SAFETEA-LU), Accidents occurred in 40 countries around the world •
BTS assumed the role in 2006 and has subsequently con- 4 countries – Bangladesh, Indonesia, the Philippines, • ducted the NCFO in 2006, 2008 and 2010. If you are and China – account for more than 50% of accidents.
in the domestic U.S. ferry and passenger vessel game or 95% of accidents occurred in developing world countries.• do business with any of the players, then the BTS RITA Bangladesh is far and away the most dangerous place • numbers arguably should be your ? rst, “GO TO” re- to board a ferry.
source. Table 1 gives a nice snapshot of what the ? eet last Adverse weather is implicated in over 50% of accidents• looked like when BTS took its temperature. Overloading is implicated in 34% of all cases.
•
The geographic scope of the database of existing ferry oper- Human error is implicated in 77% of accidents.
• ations includes the United States and its territories, encom- Human error is implicated in 87% of fatalities.
• passing the 50 States, Puerto Rico, the U.S. Virgin Islands, According to the parameters used in the WFSA analysis, and the Commonwealth of the Northern Mariana Islands. human error includes not only direct, deadly errors like
In addition to ferry operators providing domestic service overcrowding, collisions between vessels, and improper within the U.S. and its territories, operators providing ser- loading of rolling cargo, but also factors like a captain’s vices to or from at least one U.S. terminal are also included. misjudgment of safe weather conditions and vessel dis-
Ferry operations that were included within the scope of this repair. Also included are cases where human error led census are those providing itinerant, ? xed route, common to increased fatalities in an otherwise unavoidable acci- carrier passenger and/or vehicle ferry service. dent (for example, in one case, a SAR vessel didn’t have
It’s interesting to note that no particular region leads in enough gas to reach an accident site in time) or where all categories, although the western United States seems to error was likely but never proven (for instance, passengers be the most active users of ferries, followed in distant sec- said the vessel was overcrowded but capacity information ond place by the Northeastern region. Nearly two-thirds or passenger manifests are not available to bear this out). of U.S. ferry operations are privately run, with about one- All of that said; safety issues – although very, very good, third publicly administered, and the rest are a combina- by comparison in North America – are not limited to tion of both. Federal funding is authorized by the Moving developing, so-called third world countries. And, we have
Ahead for Progress in the 21st Century Act, or MAP- 21, our own share of issues. That said, the U.S. passenger
Public Law 112-141, under section 1121, which set aside vessel industry is, by any benchmark, one of the nation’s $67 million in 2014 for maintenance and improvement most highly regulated marine industries. Stay tuned for of the nation’s ferries. Under the act, the Federal Highway the latest BTS ferry data, due out in 2015. We’ll com-
Administration uses ferry-operators census data from the pare growth, trends and benchmarks in a future edition.
Bureau of Transportation Statistics to allocate funds. Click: www.rita.dot.gov to ? nd out more.
But, ferry statistics aren’t just about routes and passenger
January 2015 8 MN
MN Jan15 Layout 1-17.indd 8 MN Jan15 Layout 1-17.indd 8 12/22/2014 2:30:26 PM12/22/2014 2:30:26 PM

 7
7

 9
9
