Page 10: of Marine News Magazine (March 2015)
Fleet Optimization
Read this page in Pdf, Flash or Html5 edition of March 2015 Marine News Magazine
 9
9
 11
11
BY THE NUMBERS
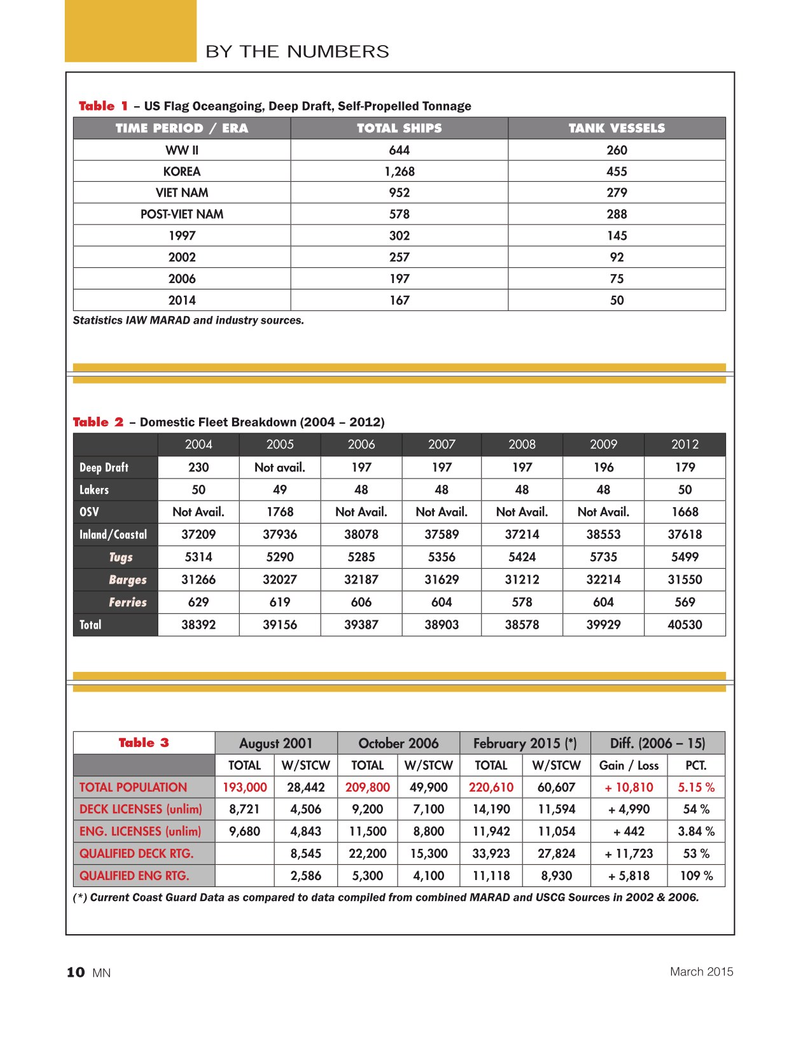
Table 1 – US Flag Oceangoing, Deep Draft, Self-Propelled Tonnage
TIME PERIOD / ERA TOTAL SHIPS TANK VESSELS
WW II 644 260
KOREA 1,268 455
VIET NAM 952 279
POST-VIET NAM 578 288 1997 302 145 2002 257 92 2006 197 75 2014 167 50
Statistics IAW MARAD and industry sources.
– Domestic Fleet Breakdown (2004 – 2012)
Table 2 2004200520062007200820092012
Deep Draft 230Not avail.197 197 197 196 179
Lakers 50 49 48 48 48 48 50
OSV Not Avail.1768Not Avail.Not Avail.Not Avail.Not Avail.1668
Inland/Coastal 37209379363807837589372143855337618 T ugs 5314529052855356542457355499 Barges 31266320273218731629312123221431550 Ferries 629 619 606 604 578 604 569
Total 38392391563938738903385783992940530
Table 3
August 2001October 2006February 2015 (*)Diff. (2006 – 15)
TOTALW/STCWTOTALW/STCWTOTALW/STCWGain / LossPCT.
TOTAL POPULATION 193,000 28,442 209,800 49,900 220,610 60,607 + 10,8105.15 %
DECK LICENSES (unlim) 8,7214,5069,2007,10014,19011,594+ 4,99054 %
ENG. LICENSES (unlim) 9,6804,84311,5008,80011,94211,054+ 4423.84 %
QUALIFIED DECK RTG. 8,54522,20015,30033,92327,824+ 11,72353 %
QUALIFIED ENG RTG. 2,5865,3004,10011,1188,930+ 5,818109 % (*) Current Coast Guard Data as compared to data compiled from combined MARAD and USCG Sources in 2002 & 2006.
March 2015 10
MN