
Page 8: of Marine News Magazine (June 2017)
Combat & Patrol Craft Annual
Read this page in Pdf, Flash or Html5 edition of June 2017 Marine News Magazine
 7
7
 9
9
BY THE NUMBERS
Transportation Environmental Performance: a tale of three modes
Dagmar Schmidt Etkin of Environmental Research Consulting always has her ? nger on the pulse of the environ- mental scene, especially when it comes to transportation issues. Her recent work, entitled “Historical Analysis of US
Pipeline Spills and Implications for Contingency Planning,” gives a robust accounting of pipeline spill performance. In this case, historical data on inland crude and re? ned product pipeline spills for the years 1968 through 2015 were ana- lyzed. While that’s a little out of our wheelhouse, it got us to thinking: how does that measure up against other modes such as tank vessels and rail? And, more importantly, is it an apples-to-apples comparison? The answer: well, sort of.
First, the pipelines: Over the 48-year time period, there were 6,433 crude and 4,377 re? ned product pipeline spills reported in inland areas of the US, involving a total of over 6.7 million barrels of spillage. Spill numbers, total volume of spillage, and average spill volume – like that emanating from tankers and barges – have decreased signi? cantly over this time period. Nevertheless, there has been an increase in crude pipeline spill numbers in the last several years even when adjusted for transmission that should be noted. But who is winning the race?
Tank Vessels: Separately, Dagmar’s numbers – as reported previously in this space – show the progress of the oil transportation industry as it improves its footprint over time. The numbers are remarkable. Oil spills from tank vessels into US waters have reduced by 99% since the early 1970s. In the last decade alone, spillage has been reduced by 76%.
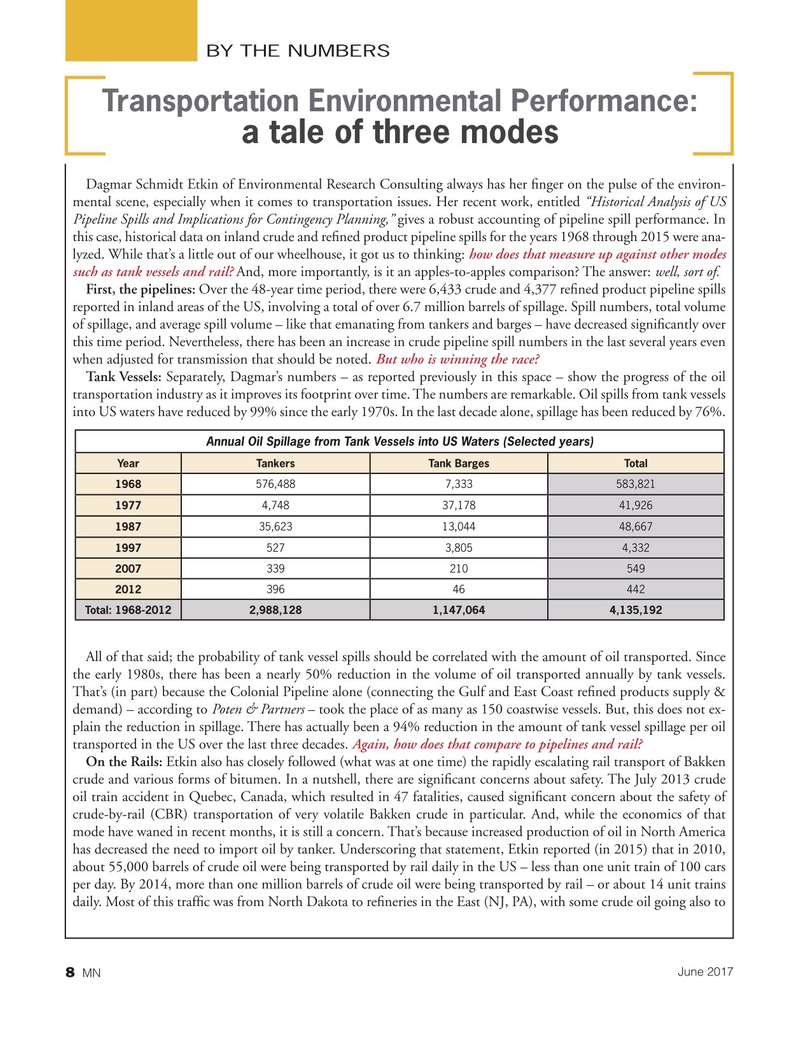
Annual Oil Spillage from Tank Vessels into US Waters (Selected years)
Year Tankers Tank Barges Total 1968 576,488 7,333 583,821 1977 4,748 37,178 41,926 1987 35,623 13,044 48,667 1997 527 3,805 4,332 2007 339 210 549 2012 396 46 442
Total: 1968-2012 2,988,128 1,147,064 4,135,192
All of that said; the probability of tank vessel spills should be correlated with the amount of oil transported. Since the early 1980s, there has been a nearly 50% reduction in the volume of oil transported annually by tank vessels.
That’s (in part) because the Colonial Pipeline alone (connecting the Gulf and East Coast re? ned products supply & demand) – according to Poten & Partners – took the place of as many as 150 coastwise vessels. But, this does not ex- plain the reduction in spillage. There has actually been a 94% reduction in the amount of tank vessel spillage per oil transported in the US over the last three decades. Again, how does that compare to pipelines and rail?
On the Rails: Etkin also has closely followed (what was at one time) the rapidly escalating rail transport of Bakken crude and various forms of bitumen. In a nutshell, there are signi? cant concerns about safety. The July 2013 crude oil train accident in Quebec, Canada, which resulted in 47 fatalities, caused signi? cant concern about the safety of crude-by-rail (CBR) transportation of very volatile Bakken crude in particular. And, while the economics of that mode have waned in recent months, it is still a concern. That’s because increased production of oil in North America has decreased the need to import oil by tanker. Underscoring that statement, Etkin reported (in 2015) that in 2010, about 55,000 barrels of crude oil were being transported by rail daily in the US – less than one unit train of 100 cars per day. By 2014, more than one million barrels of crude oil were being transported by rail – or about 14 unit trains daily. Most of this traf? c was from North Dakota to re? neries in the East (NJ, PA), with some crude oil going also to
June 2017 8
MN