
Page 10: of Marine News Magazine (March 2020)
Workboat Conversion & Repair
Read this page in Pdf, Flash or Html5 edition of March 2020 Marine News Magazine
 9
9
 11
11
BY THE NUMBERS
USCG/AWO Annual Safety Report
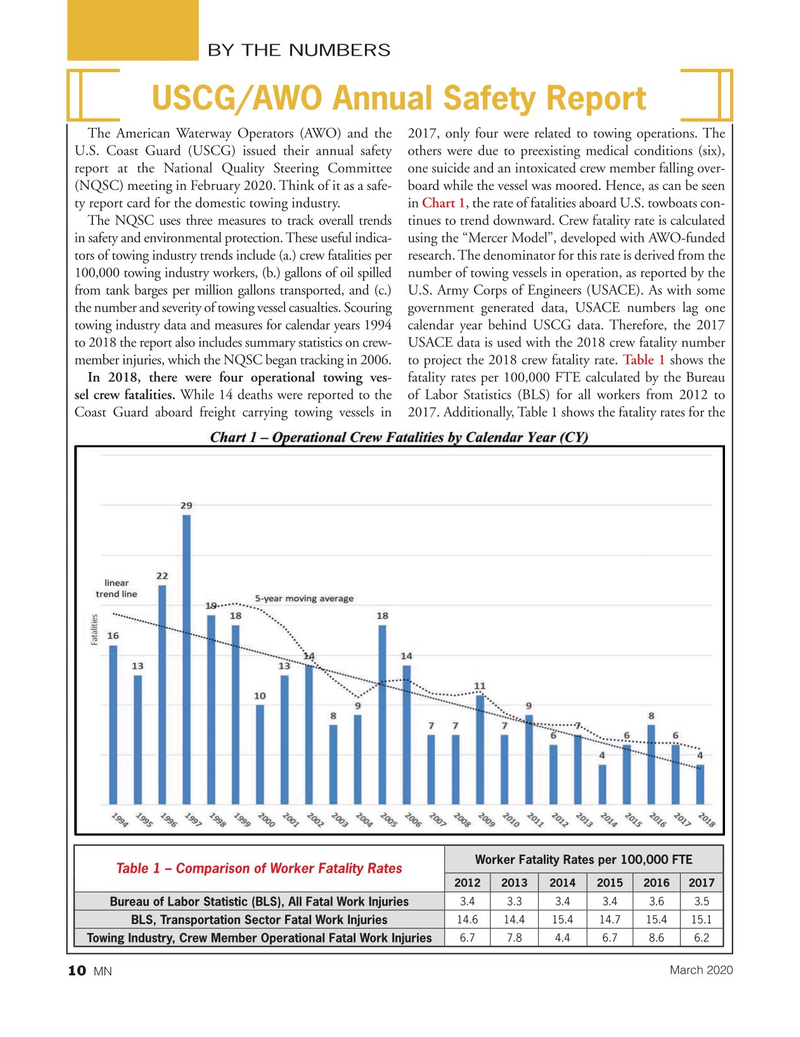
The American Waterway Operators (AWO) and the 2017, only four were related to towing operations. The
U.S. Coast Guard (USCG) issued their annual safety others were due to preexisting medical conditions (six), report at the National Quality Steering Committee one suicide and an intoxicated crew member falling over- (NQSC) meeting in February 2020. Think of it as a safe- board while the vessel was moored. Hence, as can be seen ty report card for the domestic towing industry. in Chart 1, the rate of fatalities aboard U.S. towboats con-
The NQSC uses three measures to track overall trends tinues to trend downward. Crew fatality rate is calculated in safety and environmental protection. These useful indica- using the “Mercer Model”, developed with AWO-funded tors of towing industry trends include (a.) crew fatalities per research. The denominator for this rate is derived from the 100,000 towing industry workers, (b.) gallons of oil spilled number of towing vessels in operation, as reported by the from tank barges per million gallons transported, and (c.) U.S. Army Corps of Engineers (USACE). As with some the number and severity of towing vessel casualties. Scouring government generated data, USACE numbers lag one towing industry data and measures for calendar years 1994 calendar year behind USCG data. Therefore, the 2017 to 2018 the report also includes summary statistics on crew- USACE data is used with the 2018 crew fatality number member injuries, which the NQSC began tracking in 2006. to project the 2018 crew fatality rate. Table 1 shows the
In 2018, there were four operational towing ves- fatality rates per 100,000 FTE calculated by the Bureau sel crew fatalities. While 14 deaths were reported to the of Labor Statistics (BLS) for all workers from 2012 to
Coast Guard aboard freight carrying towing vessels in 2017. Additionally, Table 1 shows the fatality rates for the
Worker Fatality Rates per 100,000 FTE
Table 1 – Comparison of Worker Fatality Rates 201220132014201520162017 3.43.33.43.43.63.5
Bureau of Labor Statistic (BLS), All Fatal Work Injuries 14.614.415.414.715.415.1
BLS, Transportation Sector Fatal Work Injuries 6.77.84.46.78.66.2
Towing Industry, Crew Member Operational Fatal Work Injuries
March 2020
MN 10