
Page 28: of Offshore Engineer Magazine (Oct/Nov 2013)
Read this page in Pdf, Flash or Html5 edition of Oct/Nov 2013 Offshore Engineer Magazine
 27
27
 29
29
Asset Integrity 2) Engineers performing structural the same as the dashed line, but with assessments require a deeper under- the uncertainty in jacket capacity given standing of the assessment methods the failure mode is a single leg failure. used by metocean consultants and The dashed dark blue line represents geotechnical engineers. the hazard curve for the Gulf of Mexico
The acceptance criteria for the with uncertainty in the load given a safety level of an offshore structure specifc storm were to occur together have developed since the early API with the uncertainty in jacket capacity codes and in particular in the 1980s given the failure mode is one of four or in the Gulf of Mexico and the 1990s in more braces failing.
Europe. These hazard curves show the
The 1980s developments came relationship between RSR (on the together under the umbrella of API left axis), ? for the DLA (on the right
E in the early 1990s after Hurricane axis) and return period for failure of
Andrew in 1992 and led to Section 17 the structural system for the SRA on being established in API for assess- the horizontal axis. These curves also ment of existing structures. The assume that the members participating work was very focused on the Gulf in the failure mechanism are domi- where platforms are unmanned for the nated by wave load rather than dead 3 extreme events and for which therefore load. As described by Efthymiou et al , reduced criteria, based on economics these hazard curves show the relation-
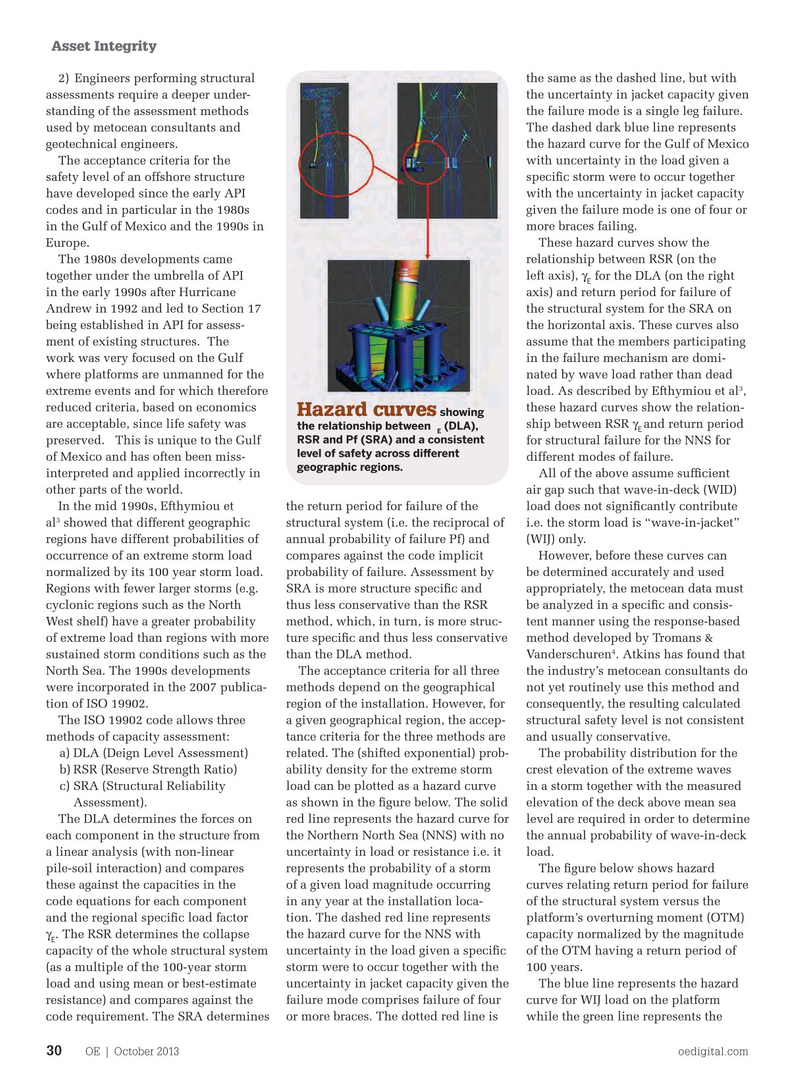
Hazard curves showing are acceptable, since life safety was ship between RSR ? and return period the relationship between (DLA), ?
E
E
RSR and Pf (SRA) and a consistent preserved. This is unique to the Gulf for structural failure for the NNS for level of safety across diferent of Mexico and has often been miss- different modes of failure. geographic regions. interpreted and applied incorrectly in All of the above assume suffcient other parts of the world. air gap such that wave-in-deck (WID)
In the mid 1990s, Efthymiou et the return period for failure of the load does not signifcantly contribute 3 al showed that different geographic structural system (i.e. the reciprocal of i.e. the storm load is “wave-in-jacket” regions have different probabilities of annual probability of failure Pf) and (WIJ) only. occurrence of an extreme storm load compares against the code implicit However, before these curves can normalized by its 100 year storm load. probability of failure. Assessment by be determined accurately and used
Regions with fewer larger storms (e.g. SRA is more structure specifc and appropriately, the metocean data must cyclonic regions such as the North thus less conservative than the RSR be analyzed in a specifc and consis-
West shelf) have a greater probability method, which, in turn, is more struc- tent manner using the response-based of extreme load than regions with more ture specifc and thus less conservative method developed by Tromans & 4 sustained storm conditions such as the than the DLA method. Vanderschuren . Atkins has found that
North Sea. The 1990s developments The acceptance criteria for all three the industry’s metocean consultants do were incorporated in the 2007 publica- methods depend on the geographical not yet routinely use this method and tion of ISO 19902. region of the installation. However, for consequently, the resulting calculated
The ISO 19902 code allows three a given geographical region, the accep- structural safety level is not consistent methods of capacity assessment: tance criteria for the three methods are and usually conservative. a) DLA (Deign Level Assessment) related. The (shifted exponential) prob- The probability distribution for the b) RSR (Reserve Strength Ratio) ability density for the extreme storm crest elevation of the extreme waves c) SRA (Structural Reliability load can be plotted as a hazard curve in a storm together with the measured
Assessment). as shown in the fgure below. The solid elevation of the deck above mean sea
The DLA determines the forces on red line represents the hazard curve for level are required in order to determine each component in the structure from the Northern North Sea (NNS) with no the annual probability of wave-in-deck a linear analysis (with non-linear uncertainty in load or resistance i.e. it load. pile-soil interaction) and compares represents the probability of a storm The fgure below shows hazard these against the capacities in the of a given load magnitude occurring curves relating return period for failure code equations for each component in any year at the installation loca- of the structural system versus the and the regional specifc load factor tion. The dashed red line represents platform’s overturning moment (OTM) ?. The RSR determines the collapse the hazard curve for the NNS with capacity normalized by the magnitude
E capacity of the whole structural system uncertainty in the load given a specifc of the OTM having a return period of (as a multiple of the 100-year storm storm were to occur together with the 100 years. load and using mean or best-estimate uncertainty in jacket capacity given the The blue line represents the hazard resistance) and compares against the failure mode comprises failure of four curve for WIJ load on the platform code requirement. The SRA determines or more braces. The dotted red line is while the green line represents the
OE | October 2013 oedigital.com 30 028_OE1013_Asset-3-Atkins.indd 30 9/29/13 8:36 PM