
Page 79: of Offshore Engineer Magazine (May/Jun 2014)
Read this page in Pdf, Flash or Html5 edition of May/Jun 2014 Offshore Engineer Magazine
 78
78
 80
80
Production
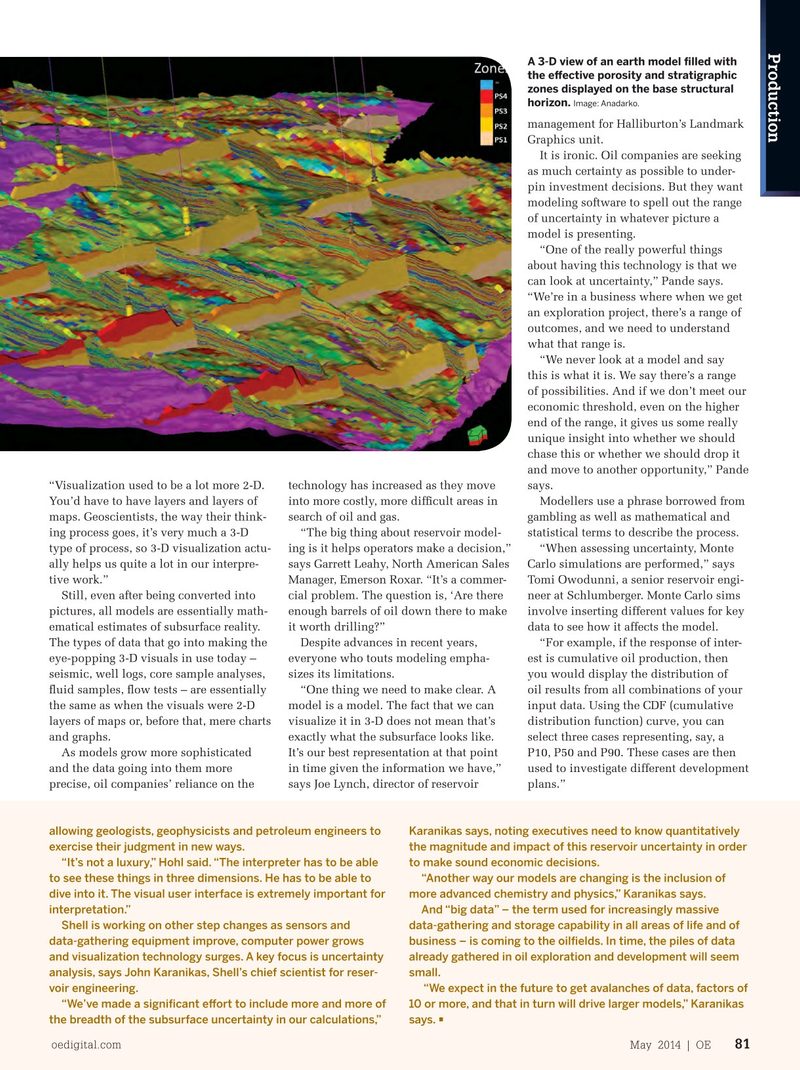
A 3-D view of an earth model flled with the efective porosity and stratigraphic zones displayed on the base structural horizon. Image: Anadarko.
management for Halliburton’s Landmark
Graphics unit.
It is ironic. Oil companies are seeking as much certainty as possible to under- pin investment decisions. But they want modeling software to spell out the range of uncertainty in whatever picture a model is presenting.
“One of the really powerful things about having this technology is that we can look at uncertainty,” Pande says. “We’re in a business where when we get an exploration project, there’s a range of outcomes, and we need to understand what that range is.
“We never look at a model and say this is what it is. We say there’s a range of possibilities. And if we don’t meet our economic threshold, even on the higher end of the range, it gives us some really unique insight into whether we should chase this or whether we should drop it and move to another opportunity,” Pande “Visualization used to be a lot more 2-D. technology has increased as they move says.
You’d have to have layers and layers of into more costly, more diffcult areas in Modellers use a phrase borrowed from maps. Geoscientists, the way their think- search of oil and gas. gambling as well as mathematical and ing process goes, it’s very much a 3-D “The big thing about reservoir model- statistical terms to describe the process.
type of process, so 3-D visualization actu- ing is it helps operators make a decision,” “When assessing uncertainty, Monte ally helps us quite a lot in our interpre- says Garrett Leahy, North American Sales Carlo simulations are performed,” says tive work.” Manager, Emerson Roxar. “It’s a commer- Tomi Owodunni, a senior reservoir engi-
Still, even after being converted into cial problem. The question is, ‘Are there neer at Schlumberger. Monte Carlo sims pictures, all models are essentially math- enough barrels of oil down there to make involve inserting different values for key ematical estimates of subsurface reality. it worth drilling?” data to see how it affects the model.
The types of data that go into making the Despite advances in recent years, “For example, if the response of inter- eye-popping 3-D visuals in use today – everyone who touts modeling empha- est is cumulative oil production, then seismic, well logs, core sample analyses, sizes its limitations. you would display the distribution of fuid samples, fow tests – are essentially “One thing we need to make clear. A oil results from all combinations of your the same as when the visuals were 2-D model is a model. The fact that we can input data. Using the CDF (cumulative layers of maps or, before that, mere charts visualize it in 3-D does not mean that’s distribution function) curve, you can and graphs. exactly what the subsurface looks like. select three cases representing, say, a
As models grow more sophisticated It’s our best representation at that point P10, P50 and P90. These cases are then and the data going into them more in time given the information we have,” used to investigate different development precise, oil companies’ reliance on the says Joe Lynch, director of reservoir plans.” allowing geologists, geophysicists and petroleum engineers to Karanikas says, noting executives need to know quantitatively exercise their judgment in new ways. the magnitude and impact of this reservoir uncertainty in order “It’s not a luxury,” Hohl said. “The interpreter has to be able to make sound economic decisions.
to see these things in three dimensions. He has to be able to “Another way our models are changing is the inclusion of dive into it. The visual user interface is extremely important for more advanced chemistry and physics,” Karanikas says.
interpretation.” And “big data” – the term used for increasingly massive
Shell is working on other step changes as sensors and data-gathering and storage capability in all areas of life and of data-gathering equipment improve, computer power grows business – is coming to the oilfelds. In time, the piles of data and visualization technology surges. A key focus is uncertainty already gathered in oil exploration and development will seem analysis, says John Karanikas, Shell’s chief scientist for reser- small.
voir engineering. “We expect in the future to get avalanches of data, factors of “We’ve made a signifcant efort to include more and more of 10 or more, and that in turn will drive larger models,” Karanikas the breadth of the subsurface uncertainty in our calculations,” says. • oedigital.com May 2014 | OE 81 080_0514OE_ProdOpsqBruceNichols.indd 81 4/19/14 8:48 AM