Page 71: of Offshore Engineer Magazine (Oct/Nov 2014)
Read this page in Pdf, Flash or Html5 edition of Oct/Nov 2014 Offshore Engineer Magazine
Pipelines 100 100
Percent in hold up -76 and temperature range
Geometry 80 80 -78 -80 60 60 -82 40 40 -84 risk range (%)
Water hold up (%) 20
Elevation (m) -86 20
Proportion spent in corrosion -88 0 0 10 20 30 40 50 60 70 80 0 -90
Temperature [°C] 0 1 2 3 4 5
Distance along pipeline (km)
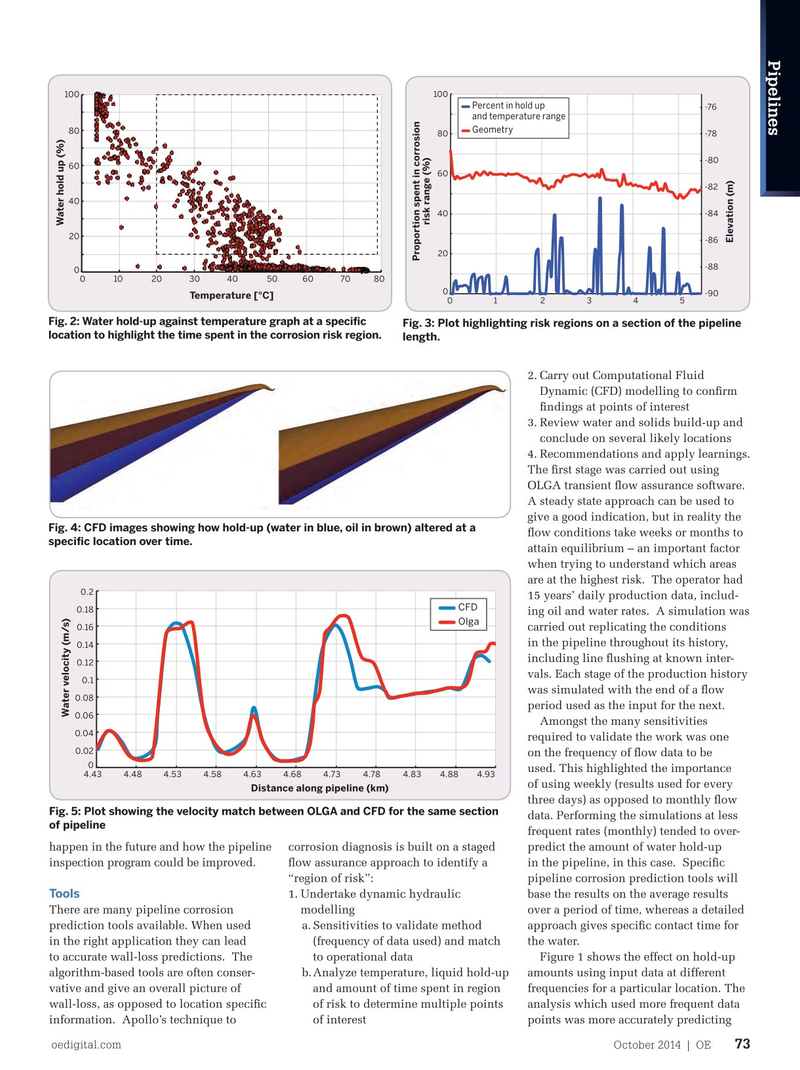
Fig. 2: Water hold-up against temperature graph at a speci? c
Fig. 3: Plot highlighting risk regions on a section of the pipeline location to highlight the time spent in the corrosion risk region.
length.
2. Carry out Computational Fluid
Dynamic (CFD) modelling to con? rm ? ndings at points of interest 3. Review water and solids build-up and conclude on several likely locations 4. Recommendations and apply learnings.
The ? rst stage was carried out using
OLGA transient ? ow assurance software.
A steady state approach can be used to give a good indication, but in reality the
Fig. 4: CFD images showing how hold-up (water in blue, oil in brown) altered at a ? ow conditions take weeks or months to speci? c location over time.
attain equilibrium – an important factor when trying to understand which areas are at the highest risk. The operator had 0.2 15 years’ daily production data, includ-
CFD 0.18 ing oil and water rates. A simulation was
Olga 0.16 carried out replicating the conditions in the pipeline throughout its history, 0.14 including line ? ushing at known inter- 0.12 vals. Each stage of the production history 0.1 was simulated with the end of a ? ow 0.08 period used as the input for the next.
Water velocity (m/s) 0.06
Amongst the many sensitivities 0.04 required to validate the work was one 0.02 on the frequency of ? ow data to be 0 used. This highlighted the importance 4.43 4.48 4.53 4.58 4.63 4.68 4.73 4.78 4.83 4.88 4.93 of using weekly (results used for every
Distance along pipeline (km) three days) as opposed to monthly ? ow
Fig. 1: Pipeline hold-up predictions using di

 70
70

 72
72