
Page 24: of Offshore Engineer Magazine (Sep/Oct 2015)
Read this page in Pdf, Flash or Html5 edition of Sep/Oct 2015 Offshore Engineer Magazine
 23
23
 25
25
Figure 1: Global FPS Installation Capex by Region 2010-2019. Graph from Douglas Westwood.
FPSO being FPSOs. The disparity between the two ? gures is from Latin America having higher than average capital costs compared to other regions due to Brazil’s higher proportion of expensive deepwater projects and high local content requirements. While the region
FPS market is expected to have the highest capex, it is unclear whether this will continue into the 2020’s with the low oil price adding to ongo- ing problems faced by Brazilian operator
Petrobras. These include a status as the world’s expected to rise most indebted company and a corruption scan- dal that has engulfed much of the oil and gas
Spending on ? oating production systems there is a dip in orders expected in 2015 and we anticipate that industry in the country. All of these issues are this will last well into 2016 with the impact on installations likely to have an impact on the capital the com- is expected to increase 73% in 2015-2019, being seen in 2018. pany can assign to new units, but are unlikely to affect the numerous sanctioned projects due with US$81 billion due to be spent over
Market forecast to Petrobras having plans in place that ensures that period. Douglas Westwood analyst
Floating production, storage, and of? oading (FPSO) units units are ordered many years before they are represent by far the largest segment of the market in terms of required.
Ben Wilby sets the scene. numbers (87 installations) and account for 81% of the forecast
Africa capex. Tension leg platforms (TLP) account for the second larg- est segment of capex (9%) with FPSs third (7%). The smallest ouglas-Westwood (DW) forecasts that between 2015 Africa will be the second largest region for segment, spars, has a forecast capex of $2.9 billion (2% of the and 2019, $81 billion will be spent on ? oating pro- spending over the forecast period with a capex
D total forecast capex). duction systems (FPS) – an increase of 73% over the of $17.8 billion (22%). Like Latin America, a
The forecast period highlights the continued increase in TLP preceding ? ve-year period. A total of 110 ? oating production large proportion of installations will take place installations and capex, continuing on from 2014, which saw units are forecast to be installed – a 41% increase. in deepwater and this will continue to drive two TLPs, the Olympus and P-61 units, installed. While no A continuing trend towards newbuilds and conversions com- spend in the region. The impact of deepwater units were installed from 2010-2013, 10 TLPs with a total capex pared to redeployments as well as projects that have already will be particularly prevalent in 2015-2017 of $7.6 billion are expected to be installed over the period. been sanctioned will ensure that spending in the sector will when a number of >1000m water depth ? elds remain high over the forecast period. are anticipated to come onstream. After this
Latin America
While the FPS market will still grow, this growth is signi? - there will be a drop in capex as the impact of
Latin America accounts for 28% of the 110 installations forecast cantly less than expected due to the collapse in oil prices and a low oil price impacts the market. This will and 32% of the projected capex, with the majority of these units installations in 2018 will decline signi? cantly as a result (i.e. hit the frontier area of East Africa hardest due to the unknown nature of developments in the area, and as a result, East Africa will have
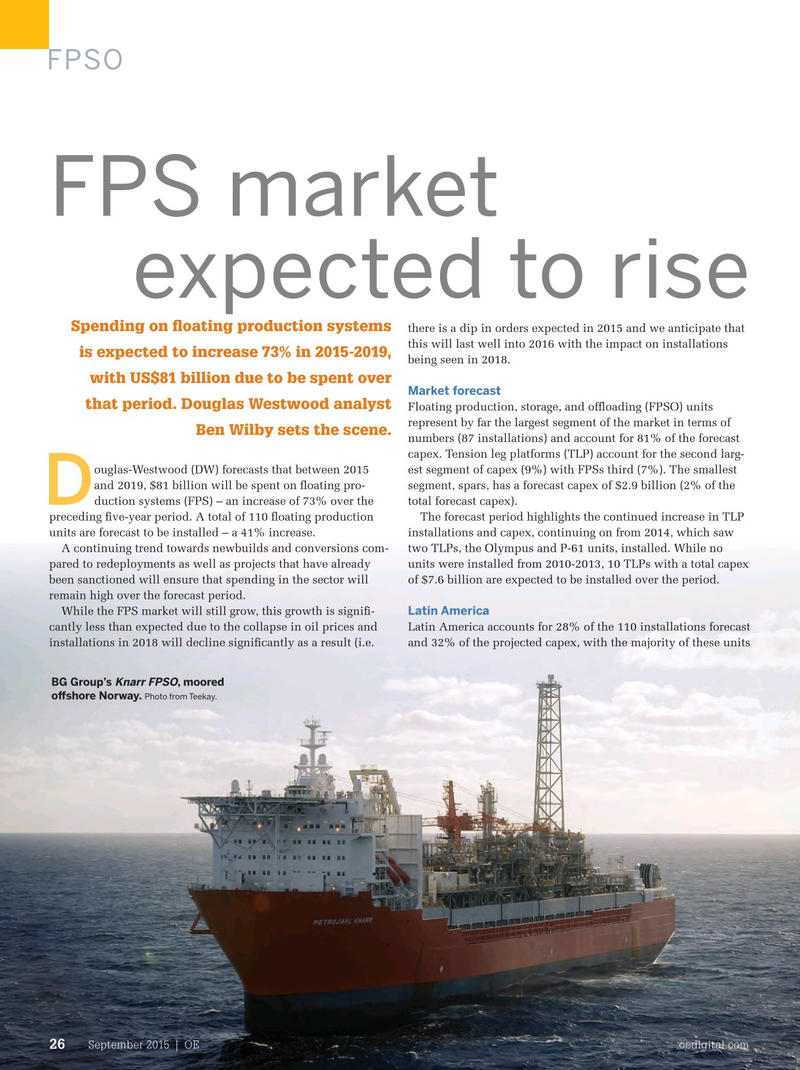
Knarr FPSO
BG Group’s , moored extremely limited deepwater production over the forecast period.
Photo from Teekay. o