Page 9: of Offshore Engineer Magazine (Sep/Oct 2021)
Digital Transformation
Read this page in Pdf, Flash or Html5 edition of Sep/Oct 2021 Offshore Engineer Magazine
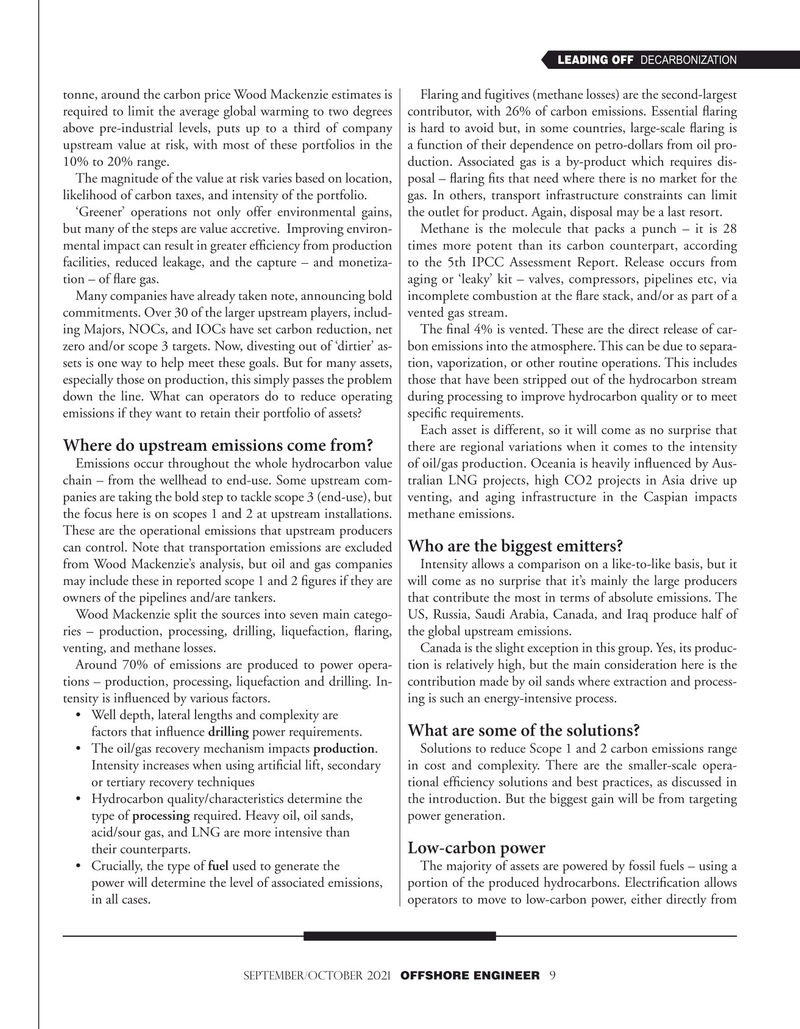
LEADING OFF DECARBONIZATION tonne, around the carbon price Wood Mackenzie estimates is Flaring and fugitives (methane losses) are the second-largest required to limit the average global warming to two degrees contributor, with 26% of carbon emissions. Essential faring above pre-industrial levels, puts up to a third of company is hard to avoid but, in some countries, large-scale faring is upstream value at risk, with most of these portfolios in the a function of their dependence on petro-dollars from oil pro- 10% to 20% range. duction. Associated gas is a by-product which requires dis-
The magnitude of the value at risk varies based on location, posal – faring fts that need where there is no market for the likelihood of carbon taxes, and intensity of the portfolio. gas. In others, transport infrastructure constraints can limit ‘Greener’ operations not only offer environmental gains, the outlet for product. Again, disposal may be a last resort.
but many of the steps are value accretive. Improving environ- Methane is the molecule that packs a punch – it is 28 mental impact can result in greater effciency from production times more potent than its carbon counterpart, according facilities, reduced leakage, and the capture – and monetiza- to the 5th IPCC Assessment Report. Release occurs from tion – of fare gas. aging or ‘leaky’ kit – valves, compressors, pipelines etc, via
Many companies have already taken note, announcing bold incomplete combustion at the fare stack, and/or as part of a commitments. Over 30 of the larger upstream players, includ- vented gas stream.
ing Majors, NOCs, and IOCs have set carbon reduction, net The fnal 4% is vented. These are the direct release of car- zero and/or scope 3 targets. Now, divesting out of ‘dirtier’ as- bon emissions into the atmosphere. This can be due to separa- sets is one way to help meet these goals. But for many assets, tion, vaporization, or other routine operations. This includes especially those on production, this simply passes the problem those that have been stripped out of the hydrocarbon stream down the line. What can operators do to reduce operating during processing to improve hydrocarbon quality or to meet emissions if they want to retain their portfolio of assets? specifc requirements.
Each asset is different, so it will come as no surprise that
Where do upstream emissions come from?
there are regional variations when it comes to the intensity
Emissions occur throughout the whole hydrocarbon value of oil/gas production. Oceania is heavily infuenced by Aus- chain – from the wellhead to end-use. Some upstream com- tralian LNG projects, high CO2 projects in Asia drive up panies are taking the bold step to tackle scope 3 (end-use), but venting, and aging infrastructure in the Caspian impacts the focus here is on scopes 1 and 2 at upstream installations. methane emissions.
These are the operational emissions that upstream producers
Who are the biggest emitters?
can control. Note that transportation emissions are excluded from Wood Mackenzie’s analysis, but oil and gas companies Intensity allows a comparison on a like-to-like basis, but it may include these in reported scope 1 and 2 fgures if they are will come as no surprise that it’s mainly the large producers owners of the pipelines and/are tankers. that contribute the most in terms of absolute emissions. The
Wood Mackenzie split the sources into seven main catego- US, Russia, Saudi Arabia, Canada, and Iraq produce half of ries – production, processing, drilling, liquefaction, faring, the global upstream emissions. venting, and methane losses. Canada is the slight exception in this group. Yes, its produc-
Around 70% of emissions are produced to power opera- tion is relatively high, but the main consideration here is the tions – production, processing, liquefaction and drilling. In- contribution made by oil sands where extraction and process- tensity is infuenced by various factors. ing is such an energy-intensive process.
• Well depth, lateral lengths and complexity are
What are some of the solutions?
factors that infuence drilling power requirements.
• The oil/gas recovery mechanism impacts production. Solutions to reduce Scope 1 and 2 carbon emissions range I ntensity increases when using artifcial lift, secondary in cost and complexity. There are the smaller-scale opera- or ter tiary recovery techniques tional effciency solutions and best practices, as discussed in • Hydrocarbon quality/characteristics determine the the introduction. But the biggest gain will be from targeting type of processing required. Heavy oil, oil sands, power generation. acid/sour gas, and LNG are more intensive than
Low-carbon power their counterparts.
• Crucially, the type of fuel used to generate the The majority of assets are powered by fossil fuels – using a po wer will determine the level of associated emissions, portion of the produced hydrocarbons. Electrifcation allows in all cases. operators to move to low-carbon power, either directly from september/october 2021 OFFSHORE ENGINEER 9

 8
8

 10
10