Page 21: of Offshore Engineer Magazine (Jul/Aug 2024)
Read this page in Pdf, Flash or Html5 edition of Jul/Aug 2024 Offshore Engineer Magazine
MARKETS OSVs themselves idle or laid up. or at their through.
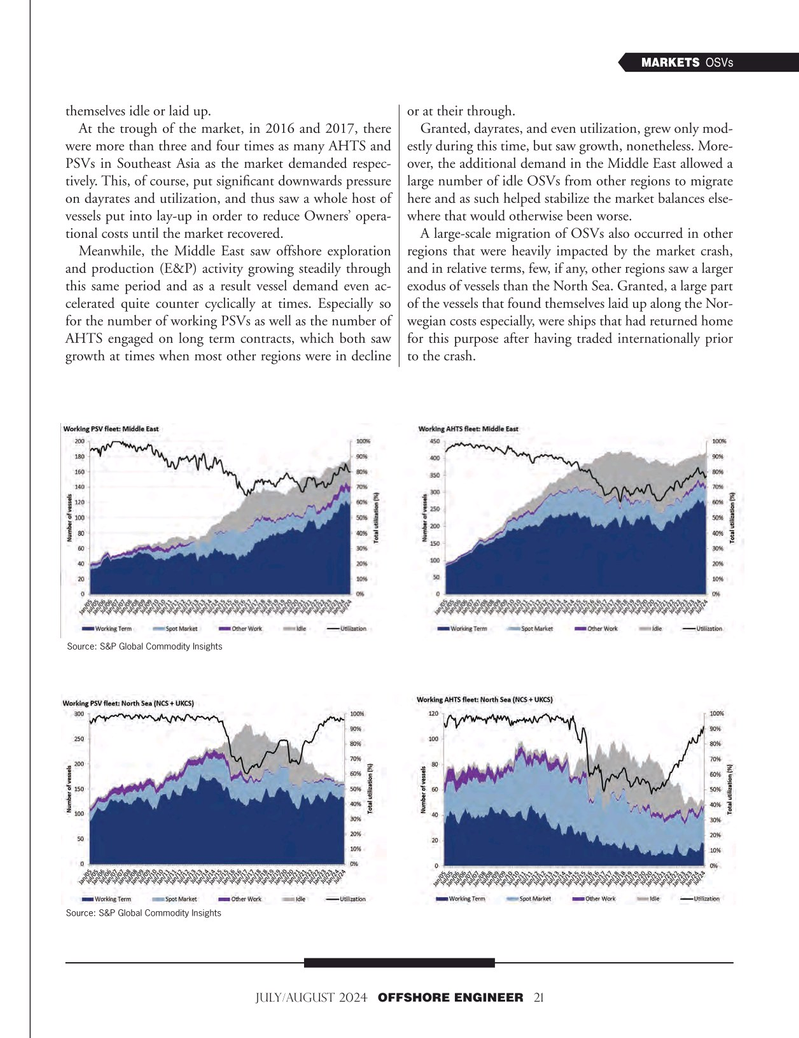
At the trough of the market, in 2016 and 2017, there Granted, dayrates, and even utilization, grew only mod- were more than three and four times as many AHTS and estly during this time, but saw growth, nonetheless. More-
PSVs in Southeast Asia as the market demanded respec- over, the additional demand in the Middle East allowed a tively. This, of course, put signifcant downwards pressure large number of idle OSVs from other regions to migrate on dayrates and utilization, and thus saw a whole host of here and as such helped stabilize the market balances else- vessels put into lay-up in order to reduce Owners’ opera- where that would otherwise been worse.
tional costs until the market recovered. A large-scale migration of OSVs also occurred in other
Meanwhile, the Middle East saw offshore exploration regions that were heavily impacted by the market crash, and production (E&P) activity growing steadily through and in relative terms, few, if any, other regions saw a larger this same period and as a result vessel demand even ac- exodus of vessels than the North Sea. Granted, a large part celerated quite counter cyclically at times. Especially so of the vessels that found themselves laid up along the Nor- for the number of working PSVs as well as the number of wegian costs especially, were ships that had returned home
AHTS engaged on long term contracts, which both saw for this purpose after having traded internationally prior growth at times when most other regions were in decline to the crash.
Source: S&P Global Commodity Insights
Source: S&P Global Commodity Insights
JULY/AUGUST 2024 OFFSHORE ENGINEER 21

 20
20

 22
22