Page 55: of Offshore Engineer Magazine (Sep/Oct 2024)
Read this page in Pdf, Flash or Html5 edition of Sep/Oct 2024 Offshore Engineer Magazine
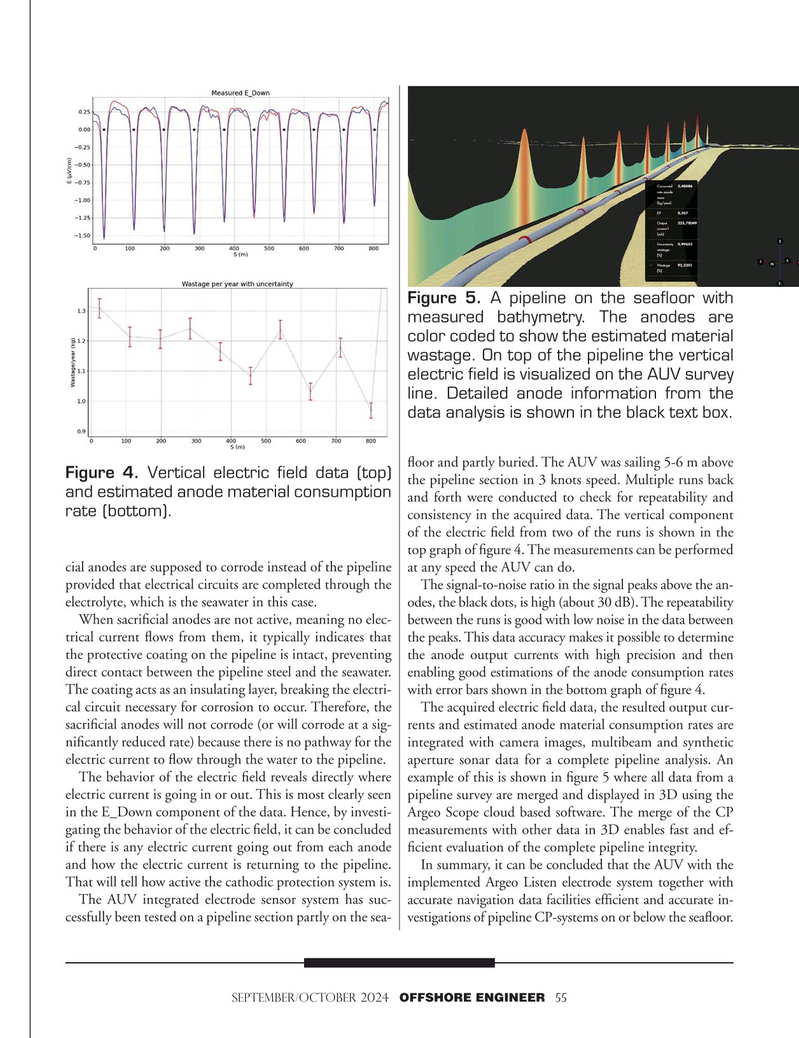
Figure 5. A pipeline on the seafloor with measured bathymetry. The anodes are color coded to show the estimated material wastage. On top of the pipeline the vertical electric field is visualized on the AUV survey line. Detailed anode information from the data analysis is shown in the black text box. ?oor and partly buried. The AUV was sailing 5-6 m above
Figure 4. Vertical electric field data (top) the pipeline section in 3 knots speed. Multiple runs back and estimated anode material consumption and forth were conducted to check for repeatability and rate (bottom).
consistency in the acquired data. The vertical component of the electric ?eld from two of the runs is shown in the top graph of ?gure 4. The measurements can be performed cial anodes are supposed to corrode instead of the pipeline at any speed the AUV can do.
provided that electrical circuits are completed through the The signal-to-noise ratio in the signal peaks above the an- electrolyte, which is the seawater in this case. odes, the black dots, is high (about 30 dB). The repeatability
When sacri?cial anodes are not active, meaning no elec- between the runs is good with low noise in the data between trical current ?ows from them, it typically indicates that the peaks. This data accuracy makes it possible to determine the protective coating on the pipeline is intact, preventing the anode output currents with high precision and then direct contact between the pipeline steel and the seawater. enabling good estimations of the anode consumption rates
The coating acts as an insulating layer, breaking the electri- with error bars shown in the bottom graph of ?gure 4. cal circuit necessary for corrosion to occur. Therefore, the The acquired electric ?eld data, the resulted output cur- sacri?cial anodes will not corrode (or will corrode at a sig- rents and estimated anode material consumption rates are ni?cantly reduced rate) because there is no pathway for the integrated with camera images, multibeam and synthetic electric current to ?ow through the water to the pipeline. aperture sonar data for a complete pipeline analysis. An
The behavior of the electric ?eld reveals directly where example of this is shown in ?gure 5 where all data from a electric current is going in or out. This is most clearly seen pipeline survey are merged and displayed in 3D using the in the E_Down component of the data. Hence, by investi- Argeo Scope cloud based software. The merge of the CP gating the behavior of the electric ?eld, it can be concluded measurements with other data in 3D enables fast and ef- if there is any electric current going out from each anode ?cient evaluation of the complete pipeline integrity.
and how the electric current is returning to the pipeline. In summary, it can be concluded that the AUV with the
That will tell how active the cathodic protection system is. implemented Argeo Listen electrode system together with
The AUV integrated electrode sensor system has suc- accurate navigation data facilities ef?cient and accurate in- cessfully been tested on a pipeline section partly on the sea- vestigations of pipeline CP-systems on or below the sea?oor.
september/october 2024 OFFSHORE ENGINEER 55

 54
54

 56
56