
Page 29: of Marine Technology Magazine (Jun/Jul 2011)
Hydrographic Survey
Read this page in Pdf, Flash or Html5 edition of Jun/Jul 2011 Marine Technology Magazine
 28
28
 30
30
www.seadiscovery.com Marine Technology Reporter 29 was reached, forcing the closure of the shallow set fishery,” says Howell. In response to this closure, NOAA began working on a dynamic product that would show spatially where the highest number of loggerhead sea turtles was more apt to be found. Based off work by Jeffrey Polovina,
Donald Kobayashi and with other colleagues at the Pacific
Islands Fisheries Science Center (PIFSC), Howell looked at all the data he had from logbooks taken from the long- line fishing industry, what loggerhead turtles and sword- fish were more prone to eat, sea surface temperature, and chlorophyll-a data that had been gathered remotely, along with migration routes from several turtles that had been outfitted with satellite transmitters. Most of the work, admits Howell, had already been done by others. “PIFSC has been going up to the transition zone for a long time,” Howell explains. “There’s a 1980 technical report with a bunch of nice work from up there”. Before
Howell, much of the research on this ecosystem had been teased out. PIFSC knew that ecological domain after hav- ing observed remotely sensed data and linking this with in situ observations made from oceanographic vessels. They had already tracked turtles using satellites. But none of this research had been assimilated into an operational product that stakeholders could use. Enter TurtleWatch.
For an operational product that the fishing industry could use easily, Howell used work from his colleagues at
PIFSC who found that there was a strong relationship between sea surface temperature and where loggerhead sea
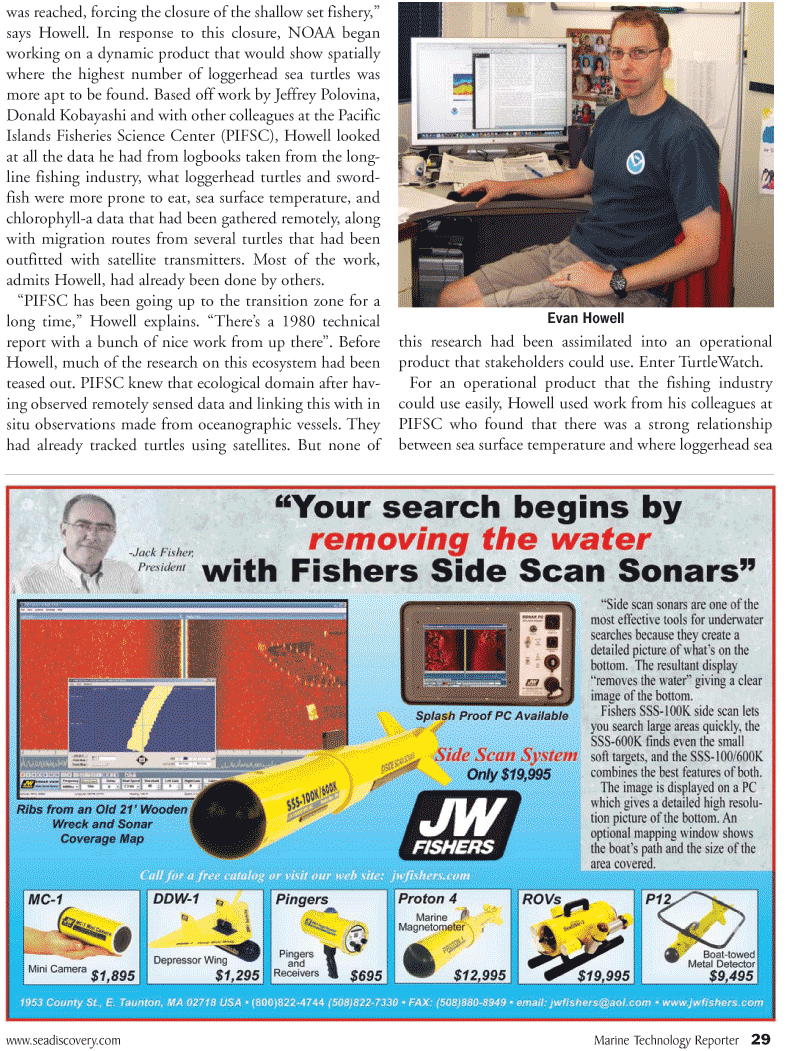
Evan Howell