
Page 16: of Marine Technology Magazine (May/Jun 2013)
Hydrographic Survey
Read this page in Pdf, Flash or Html5 edition of May/Jun 2013 Marine Technology Magazine
 15
15
 17
17
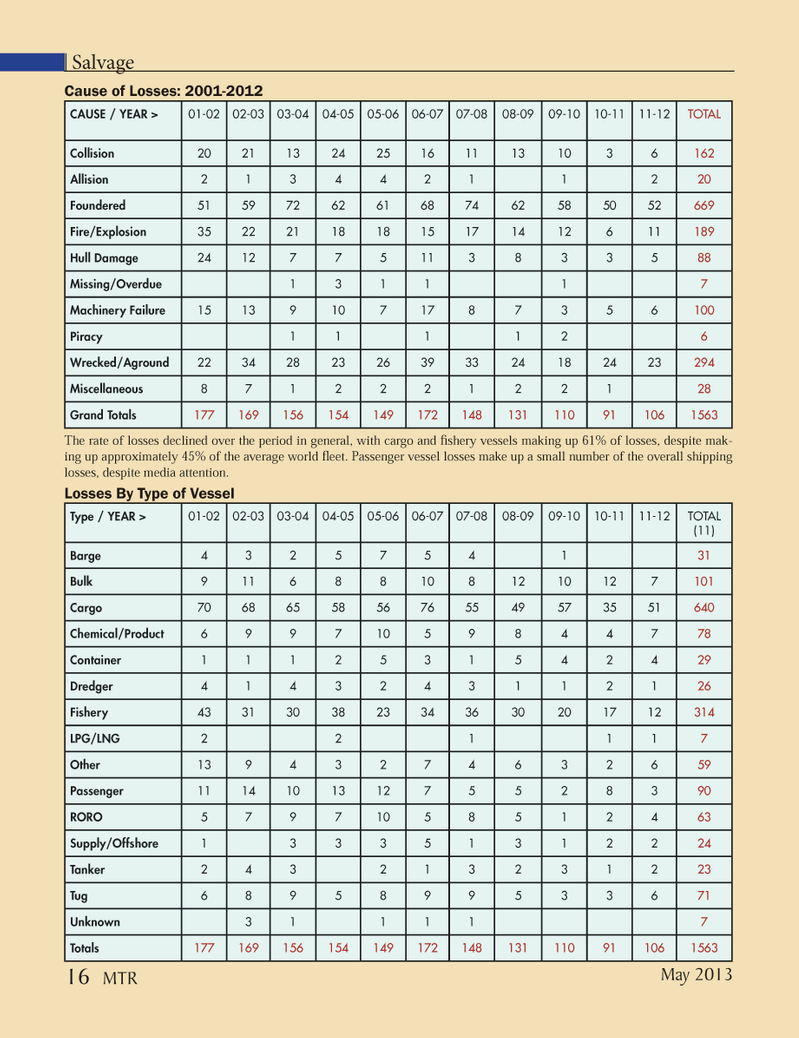
Salvage The rate of losses declined over the period in general, with cargo and Þ shery vessels making up 61% of losses, despite mak- ing up approximately 45% of the average world ß eet. Passenger vessel losses make up a small number of the overall shipping losses, despite media attention.CAUSE / YEAR >01-0202-0303-0404-0505-0606-0707-0808-0909-1010-1111-12 TOTAL Collision20211324251611131036 162Allision2134421 12 20Foundered5159726261687462585052 669Fire/Explosion352221181815171412611 189Hull Damage24127751138335 88Missing/Overdue1311 17Machinery Failure 151391071787356 100Piracy11112 6Wrecked/Aground 2234282326393324182423 294Miscellaneous8712221221 28Grand Totals 177169156154149172148131110911061563 Type / YEAR > 01-0202-0303-0404-0505-0606-0707-0808-0909-1010-1111-12TOTAL (11)Barge43257541 31Bulk9116881081210127 101Cargo7068655856765549573551 640Chemical/Product699710598447 78Container11125315424 29Dredger41432431121 26Fishery 4331303823343630201712 314LPG/LNG2211 17Other139432746326 59Passenger1114101312755283 90RORO579710585124 63Supply/Offshore 1333513122 24Tanker 2432132312 23Tug 68958995336 71Unknown31111 7Totals 177169156154149172148131110911061563 Cause of Losses: 2001-2012 Losses By Type of Vessel May 201316 MTRMTR #4 (1-17).indd 16MTR #4 (1-17).indd 165/6/2013 9:58:00 AM5/6/2013 9:58:00 AM