
Page 51: of Marine Technology Magazine (Sep/Oct 2020)
Read this page in Pdf, Flash or Html5 edition of Sep/Oct 2020 Marine Technology Magazine
 50
50
 52
52
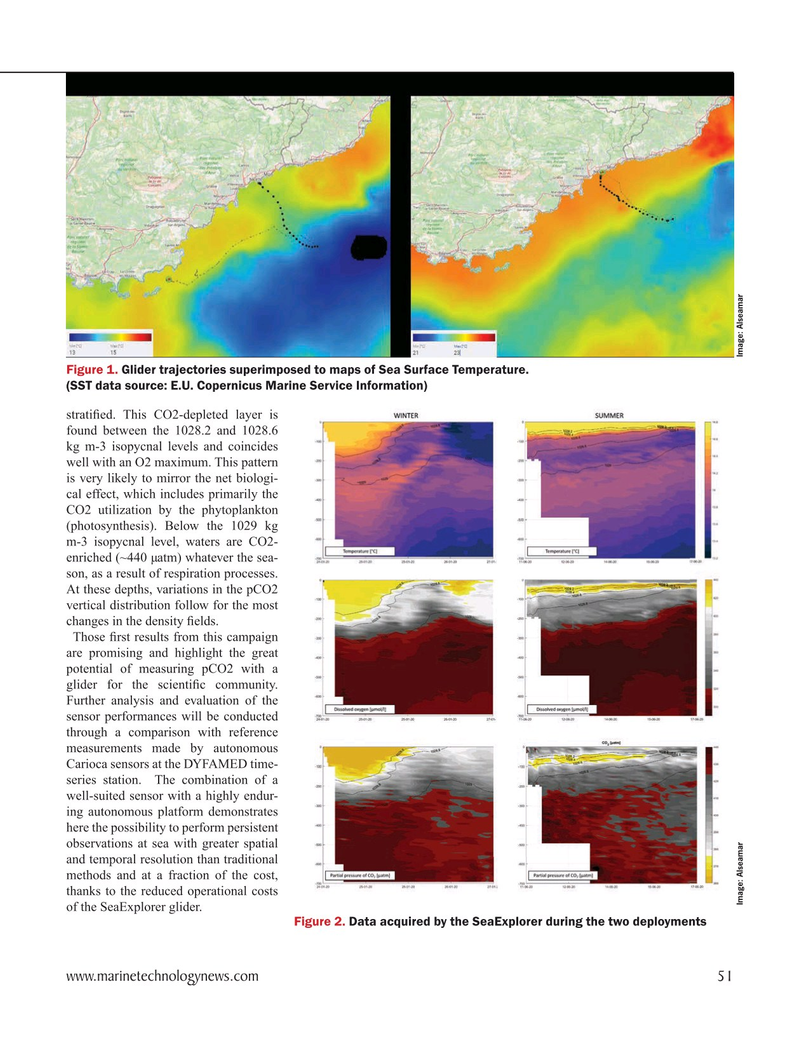
Figure 1. Glider trajectories superimposed to maps of Sea Surface Temperature.
(SST data source: E.U. Copernicus Marine Service Information) strati? ed. This CO2-depleted layer is found between the 1028.2 and 1028.6 kg m-3 isopycnal levels and coincides well with an O2 maximum. This pattern is very likely to mirror the net biologi- cal effect, which includes primarily the
CO2 utilization by the phytoplankton (photosynthesis). Below the 1029 kg m-3 isopycnal level, waters are CO2- enriched (~440 µatm) whatever the sea- son, as a result of respiration processes.
At these depths, variations in the pCO2 vertical distribution follow for the most changes in the density ? elds.
Those ? rst results from this campaign are promising and highlight the great potential of measuring pCO2 with a glider for the scienti? c community.
Further analysis and evaluation of the sensor performances will be conducted through a comparison with reference measurements made by autonomous
Carioca sensors at the DYFAMED time- series station. The combination of a well-suited sensor with a highly endur- ing autonomous platform demonstrates here the possibility to perform persistent observations at sea with greater spatial and temporal resolution than traditional methods and at a fraction of the cost, thanks to the reduced operational costs
Image: Alseamar Image: Alseamar of the SeaExplorer glider.
Figure 2. Data acquired by the SeaExplorer during the two deployments www.marinetechnologynews.com 51
MTR #7 (50-63).indd 51 9/11/2020 1:00:16 PM