
Page 12: of Maritime Reporter Magazine (December 1971)
Read this page in Pdf, Flash or Html5 edition of December 1971 Maritime Reporter Magazine
 11
11
 13
13
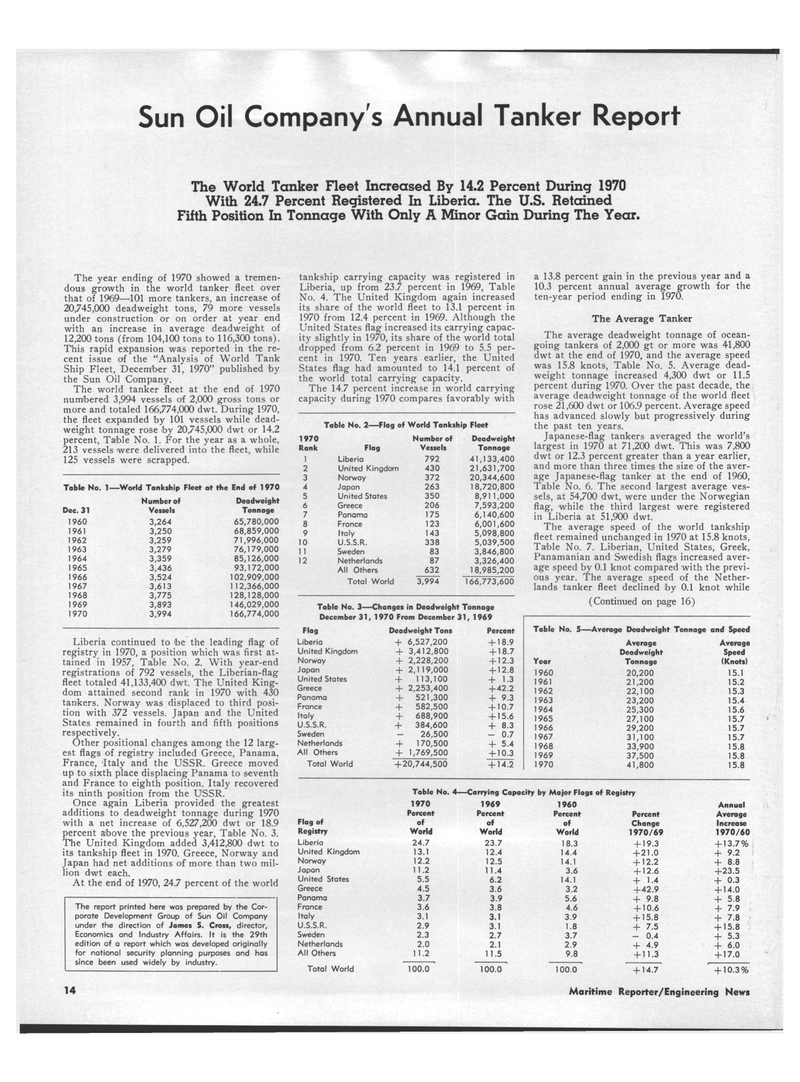
Sun Oil Company's Annual Tanker Report
The World Tanker Fleet Increased By 14.2 Percent During 1970
With 24.7 Percent Registered In Liberia. The U.S. Retained
Fifth Position In Tonnage With Only A Minor Gain During The Year.
The year ending of 1970 showed a tremen- dous growth in the world tanker fleet over that of 1969—101 more tankers, an increase of 20,745,000 deadweight tons, 79 more vessels under construction or on order at year end with an increase in average deadweight of 12,200 tons (from 104,100 tons to 116,300 tons).
This rapid expansion was reported in the re- cent issue of the "Analysis of World Tank
Ship Fleet, December 31, 1970" published by the Sun Oil Company.
The world tanker fleet at the end of 1970 numbered 3,994 vessels of 2,000 gross tons or more and totaled 166,774,000 dwt. During 1970, the fleet expanded by 101 vessels while dead- weight tonnage rose by 20,745,000 dwt or 14.2 percent, Table No. 1. For the year as a whole, 213 vessels were delivered into the fleet, while 125 vessels were scrapped.
Table No. 1 —World Tankship Fleet at the End of 1970
Number of Deadweight
Dec. 31 Vessels Tonnage 1960 3,264 65,780,000 1961 3,250 68,859,000 1962 3,259 71,996,000 1963 3,279 76,179,000 1964 3,359 85,126,000 1965 3,436 93,172,000 1966 3,524 102,909,000 1967 3,613 1 12,366,000 1968 3,775 128,128,000 1969 3,893 146,029,000 1970 3,994 166,774,000
Liberia continued to be the leading flag of registry in 1970, a position which was first at- tained in 1957, Table No. 2. With year-end registrations of 792 vessels, the Liberian-flag fleet totaled 41,133,400 dwt. The United King- dom attained second rank in 1970 with 430 tankers. Norway was displaced to third posi- tion with 372 vessels. Japan and the United
States remained in fourth and fifth positions respectively.
Other positional changes among the 12 larg- est flags of registry included Greece, Panama,
France, Italy and the USSR. Greece moved up to sixth place displacing Panama to seventh and France to eighth position. Italy recovered its ninth position from the USSR.
Once again Liberia provided the greatest additions to deadweight tonnage during 1970 with a net increase of 6,527,200 dwt or 18.9 percent above the previous year, Table No. 3.
The United Kingdom added 3,412,800 dwt to its tankship fleet in 1970. Greece, Norway and
Japan had net additions of more than two mil- lion dwt each.
At the end of 1970, 24.7 percent of the world
The report printed here was prepared by the Cor- porate Development Group of Sun Oil Company under the direction of James S. Cross, director,
Economics and Industry Affairs. It is the 29th edition of a report which was developed originally for national security planning purposes and has since been used widely by industry. tankship carrying capacity was registered in
Liberia, up from 23.7 percent in 1969, Table
No. 4. The United Kingdom again increased its share of the world fleet to 13.1 percent in 1970 from 12.4 percent in 1969. Although the
United States flag increased its carrying capac- ity slightly in 1970, its share of the world total dropped from 6.2 percent in 1969 to 5.5 per- cent in 1970. Ten years earlier, the United
States flag had amounted to 14.1 percent of the world total carrying capacity.
The 14.7 percent increase in world carrying capacity during 1970 compares favorably with
Table No. 2—Flag of World Tankship Fleet 1970 Number of Deadweight
Rank Flag Vessels Tonnage 1 Liberia 792 41,133,400 2 United Kingdom 430 21,631,700 3 Norway 372 20,344,600 4 Japan 263 18,720,800 5 United States 350 8,91 1,000 6 Greece 206 7,593,200 7 Panama 175 6,140,600 8 France 123 6,001,600 9 Italy 143 5,098,800 10 U.S.S.R. 338 5,039,500 1 1 Sweden 83 3,846,800 12 Netherlands 87 3,326,400
All Others 632 18,985,200
Total World 3,994 166,773,600
Table No. 3—Changes in Deadweight Tonnage
December 31, 1970 From December 31, 1969
Flag Deadweight Tons Percent
Liberia + 6,527,200 + 18.9
United Kingdom + 3,412,800 + 18.7
Norway + 2,228,200 + 12.3
Japan + 2,1 19,000 + 12.8
United States + 1 13,100 + 1.3
Greece + 2,253,400 +42.2
Panama + 521,300 + 9.3
France + 582,500 + 10.7
Italy + 688,900 + 15.6
U.S.S.R. + 384,600 + 8.3
Sweden — 26,500 - 0.7
Netherlands + 170,500 + 5.4
All Others + 1,769,500 + 10.3
Total World + 20,744,500 + 14.2 a 13.8 percent gain in the previous year and a 10.3 percent annual average growth for the ten-year period ending in 1970.
The Average Tanker
The average deadweight tonnage of ocean- going tankers of 2,000 gt or more was 41,800 dwt at the end of 1970, and the average speed was 15.8 knots, Table No. 5. Average dead- weight tonnage increased 4,300 dwt or 11.5 percent during 1970. Over the past decade, the average deadweight tonnage of the world fleet rose 21,600 dwt or 106.9 percent. Average speed has advanced slowly but progressively during the past ten years.
Japanese-flag tankers averaged the world's largest in 1970 at 71,200 dwt. This was 7,800 dwt or 12.3 percent greater than a year earlier, and more than three times the size of the aver- age Japanese-flag tanker at the end of I960,
Table No. 6. The second largest average ves- sels, at 54,700 dwt, were under the Norwegian flag, while the third largest were registered in Liberia at 51,900 dwt.
The average speed of the world tankship fleet remained unchanged in 1970 at 15.8 knots,
Table No. 7. Liberian, United States, Greek,
Panamanian and Swedish flags increased aver- age speed by 0.1 knot compared with the previ- ous year. The average speed of the Nether- lands tanker fleet declined by 0.1 knot while (Continued on page 16)
Table No. 5—Average Deadweight Tonnage and Speed
Average Average
Deadweight Speed
Year Tonnage (Knots) 1960 20,200 15.1 1961 21,200 15.2 1962 22,100 15.3 1963 23,200 15.4 1964 25,300 15.6 1965 27,100 15.7 1966 29,200 15.7 1967 31,100 15.7 1968 33,900 15.8 1969 37,500 15.8 1970 41,800 15.8
Table No. A—Carrying Capacity by Major Flags of Registry 1970 1969 1960 Annual
Percent Percent Percent Percent Average
Flag of of of of Change Increase
Registry World World World 1970/69 1970/60
Liberia 24.7 23.7 18.3 + 19.3 + 13.7%
United Kingdom 13.1 12.4 14.4 +21.0 + 9.2 i
Norway 12.2 12.5 14.1 + 12.2 + 8.8
Japan 11.2 1 1.4 3.6 + 12.6 +23.5
United States 5.5 6.2 14.1 + 1-4 + 0.3
Greece 4.5 3.6 3.2 +42.9 + 14.0
Panama 3.7 3.9 5.6 + 9.8 + 5.8
France 3.6 3.8 4.6 + 10.6 + 7.9
Italy 3.1 3.1 3.9 + 15.8 + 7.8
U.S.S.R. 2.9 3.1 1.8 + 7.5 + 15.8
Sweden 2.3 2.7 3.7 - 0.4 + 5.3
Netherlands 2.0 2.1 2.9 + 4.9 + 6.0
All Others 1 1.2 11.5 9.8 + 11.3 + 17.0
Total World 100.0 100.0 100.0 + 14.7 + 10.3% 14 Maritime Reporter/Engineering News
