
Page 14: of Maritime Reporter Magazine (December 1971)
Read this page in Pdf, Flash or Html5 edition of December 1971 Maritime Reporter Magazine
 13
13
 15
15
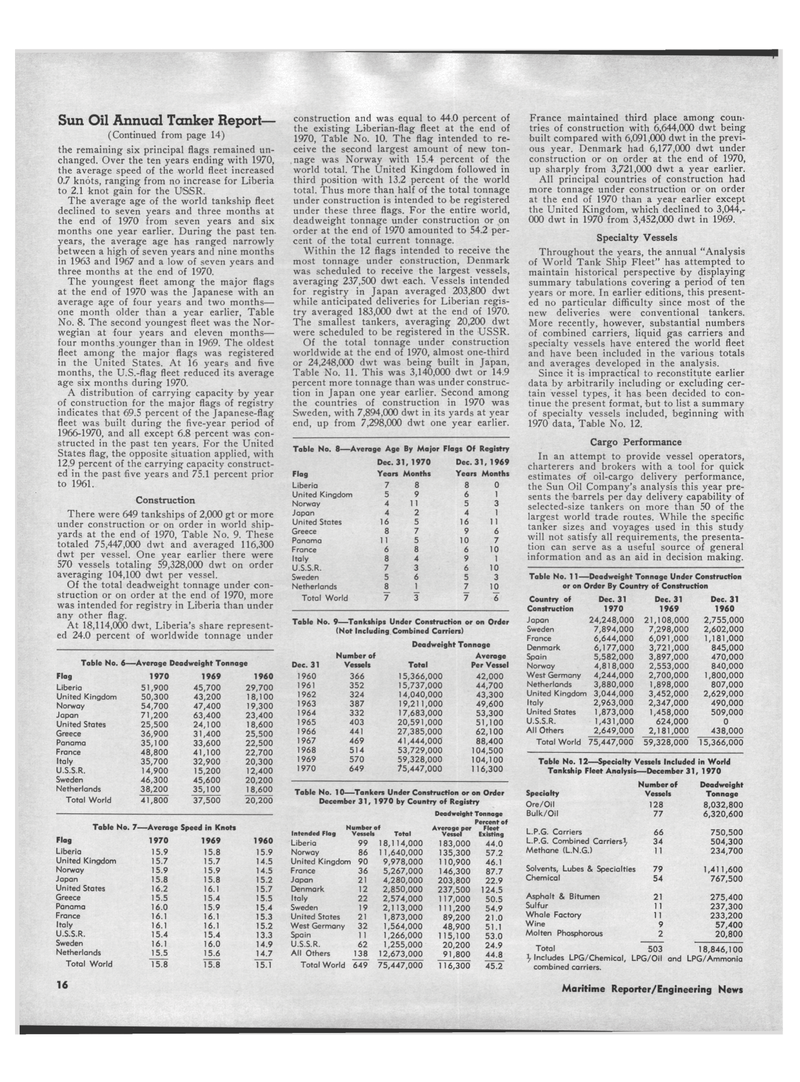
Sun Oil Annual Tanker Report— (Continued from page 14) the remaining six principal flags remained un- changed. Over the ten years ending with 1970, the average speed of the world fleet increased 0.7 knots, ranging from no increase for Liberia to 2.1 knot gain for the USSR.
The average age of the world tankship fleet declined to seven years and three months at the end of 1970 from seven years and six months one year earlier. During the past ten. years, the average age has ranged narrowly between a high of seven years and nine months in 1963 and 1967 and a low of seven years and three months at the end of 1970.
The youngest fleet among the major flags at the end of 1970 was the Japanese with an average age of four years and two months— one month older than a year earlier, Table
No. 8. The second youngest fleet was the Nor- wegian at four years and eleven months— four months younger than in 1969. The oldest fleet among the major flags was registered in the United States. At 16 years and five months, the U.S.-flag fleet reduced its average age six months during 1970.
A distribution of carrying capacity by year of construction for the major flags of registry indicates that 69.5 percent of the Japanese-flag fleet was built during the five-year period of 1966-1970, and all except 6.8 percent was con- structed in the past ten years. For the United
States flag, the opposite situation applied, with 12.9 percent of the carrying capacity construct- ed in the past five years and 75.1 percent prior to 1961.
Construction
There were 649 tankships of 2,000 gt or more under construction or on order in world ship- yards at the end of 1970, Table No. 9. These totaled 75,447,000 dwt and averaged 116,300 dwt per vessel. One year earlier there were 570 vessels totaling 59,328,000 dwt on order averaging 104,100 dwt per vessel.
Of the total deadweight tonnage under con- struction or on order at the end of 1970, more was intended for registry in Liberia than under any other flag.
At 18,114,000 dwt, Liberia's share represent- ed 24.0 percent of worldwide tonnage under
Table No. 6—Average Deadweight Tonnage
Flag 1970 1969 1960
Liberia 51,900 45,700 29,700
United Kingdom 50,300 43,200 18,100
Norway 54,700 47,400 19,300
Japan 71,200 63,400 23,400
United States 25,500 24,100 18,600
Greece 36,900 31,400 25,500
Panama 35,100 33,600 22,500
France 48,800 41,100 22,700
Italy 35,700 32,900 20,300
U.S.S.R. 14,900 15,200 12,400
Sweden 46,300 45,600 20,200
Netherlands 38,200 35,100 18,600
Total World 41,800 37,500 20,200
Table No. 7-—Average Speed in Knots
Flag 1970 1969 1960
Liberia 15.9 15.8 15.9
United Kingdom 15.7 15.7 14.5
Norway 15.9 15.9 14.5
Japan 15.8 15.8 15.2
United States 16.2 16.1 15.7
Greece 15.5 15.4 15.5
Panama 16.0 15.9 15.4
France 16.1 16.1 15.3
Italy 16.1 16.1 15.2
U.S.S.R. 15.4 15.4 13.3
Sweden 16.1 16.0 14.9
Netherlands 15.5 15.6 14.7
Total World 15.8 15.8 15.1 construction and was equal to 44.0 percent of the existing Liberian-flag fleet at the end of 1970, Table No. 10. The flag intended to re- ceive the second largest amount of new ton- nage was Norway with 15.4 percent of the world total. The United Kingdom followed in third position with 13.2 percent of the world total. Thus more than half of the total tonnage under construction is intended to be registered under these three flags. For the entire world, deadweight tonnage under construction or on order at the end of 1970 amounted to 54.2 per- cent of the total current tonnage.
Within the 12 flags intended to receive the most tonnage under construction, Denmark was scheduled to receive the largest vessels, averaging 237,500 dwt each. Vessels intended for registry in Japan averaged 203,800 dwt while anticipated deliveries for Liberian regis- try averaged 183,000 dwt at the end of 1970.
The smallest tankers, averaging 20,200 dwt were scheduled to be registered in the USSR.
Of the total tonnage under construction worldwide at the end of 1970, almost one-third or 24,248,000 dwt was being 'built in Japan,
Table No. 11. This was 3,140,000 dwt or 14.9 percent more tonnage than was under construc- tion in Japan one year earlier. Second among the countries of construction in 1970 was
Sweden, with 7,894,000 dwt in its yards at year end, up from 7,298,000 dwt one year earlier.
Table No. 8—Average Age By Major Flags Of Registry
Dec. 31, 1970 Dec. 31,1969
Flag Years Months Years Mont
Liberia 7 8 8 0
United Kingdom 5 9 6 1
Norway 4 1 1 5 3
Japan 4 2 4 1
United States 16 5 16 1 1
Greece 8 7 9 6
Panama 1 1 5 10 7
France 6 8 6 10
Italy 8 4 9 1
U.S.S.R. 7 3 6 10
Sweden 5 6 5 3
Netherlands 8 1 7 10
Total World 7 3 7 6
Table No. 9—Tankships Under Construction or on Order (Not Including Combined Carriers)
Deadweight Tonnage
Number of Average
Dec. 31 Vessels Total Per Vessel 1960 366 15,366,000 42,000 1961 352 15,737,000 44,700 1962 324 14,040,000 43,300 1963 387 19,21 1,000 49,600 1964 332 17,683,000 53,300 1965 403 20,591,000 51,100 1966 441 27,385,000 62,100 1967 469 41,444,000 88,400 1968 514 53,729,000 104,500 1969 570 59,328,000 104,100 1970 649 75,447,000 116,300
Table No. 10—Tankers Under Construction or on Order
December 31, 1970 by Country of Registry
Deadweight Tonnage
Number of
Intended Flag Vessels Total
Percent of
Average per Fleet
Vessel Existing
Liberia 99 18,114,000 183,000 44.0
Norway 86 1 1,640,000 135,300 57.2
United Kingdom 90 9,978,000 110,900 46.1
France 36 5,267,000 146,300 87.7
Japan 21 4,280,000 203,800 22.9
Denmark 12 2,850,000 237,500 124.5
Italy 22 2,574,000 117,000 50.5
Sweden 19 2,1 13,000 1 1 1,200 54.9
United States 21 1,873,000 89,200 21.0
West Germany 32 1,564,000 48,900 51.1
Spain 1 1 1,266,000 115,100 53.0
U.S.S.R. 62 1,255,000 20,200 24.9
All Others 138 12,673,000 91,800 44.8
Total World 649 75,447,000 116,300 45.2
France maintained third place among coun- tries of construction with 6,644,000 dwt being built compared with 6,091,000 dwt in the previ- ous year. Denmark had 6,177,000 dwt under construction or on order at the end of 1970, up sharply from 3,721,000 dwt a year earlier.
All principal countries of construction had more tonnage under construction or on order at the end of 1970 than a year earlier except the United Kingdom, which declined to 3,044,- 000 dwt in 1970 from 3,452,000 dwt in 1969.
Specialty Vessels
Throughout the years, the annual "Analysis of World Tank Ship Fleet" has attempted to maintain historical perspective by displaying summary tabulations covering a period of ten years or more. In earlier editions, this present- ed no particular difficulty since most of the new deliveries were conventional tankers.
More recently, however, substantial numbers of combined carriers, liquid gas carriers and specialty vessels have entered the world fleet and have been included in the various totals and averages developed in the analysis.
Since it is impractical to reconstitute earlier data by arbitrarily including or excluding cer- tain vessel types, it has been decided to con- tinue the present format, but to list a summary of specialty vessels included, beginning with 1970 data, Table No. 12.
Cargo Performance
In an attempt to provide vessel operators, charterers and brokers with a tool for quick estimates df oil-cargo delivery performance, the Sun Oil Company's analysis this year pre- sents the 'barrels per day delivery capability of selected-size tankers on more than 50 of the largest world trade routes. While the specific tanker sizes and voyages used in this study will not satisfy all requirements, the presenta- tion can serve as a useful source of general information and as an aid in decision making.
Table No. 11—Deadweight Tonnage Under Construction or on Order By Country of Construction
Country of Dec. 31 Dec. 31 Dec. 31
Construction 1970 1969 1960
Japan 24,248,000 21,108,000 2,755,000
Sweden 7,894,000 7,298,000 2,602,000
France 6,644,000 6,091,000 1,181,000
Denmark 6,177,000 3,721,000 845,000
Spain 5,582,000 3,897,000 470,000
Norway 4,818,000 2,553,000 840,000
West Germany 4,244,000 2,700,000 1,800,000
Netherlands 3,880,000 1,898,000 807,000
United Kingdom 3,044,000 3,452,000 2,629,000
Italy 2,963,00 2,347,000 490,000
United States 1,873,000 1,458,000 509,000
U.S.S.R. 1,431,000 624,000 0
All Others 2,649,000 2,181,000 438,000
Total World 75,447,000 59,328,000 15,366,000
Table No. 12—Specialty Vessels Included in World
Tankship Fleet Analysis—December 31, 1970
Number of Deadweight
Specialty Vessels Tonnage
Ore/Oil 128 8,032,800
Bulk/Oil 77 6,320,600
L.P.G. Carriers 66 750,500
L.P.G. Combined Carriers*- 34 504,300
Methane (L.N.G.) 1 1 234,700
Solvents, Lubes & Specialties 79 1,411,600
Chemical 54 767,500
Asphalt & Bitumen 21 275,400
Sulfur 11 237,300
Whale Factory 1 1 233,200
Wine 9 57,400
Molten Phosphorous 2 20,800
Total 503 18,846,100 \ Includes LPG/Chemical, LPG/Oil and LPG/Ammonia combined carriers. 16 Maritime Reporter/Engineering News
