
Page 62: of Maritime Reporter Magazine (June 1985)
Read this page in Pdf, Flash or Html5 edition of June 1985 Maritime Reporter Magazine
 61
61
 63
63
Offshore Service Vessels, Tugboat
And Inland Towboat Fleets
It is estimated there are ap- proximately 10,000 self pro- pelled tugs, towboats and off- shore service vessels in the
U.S. fleet.
Add to the above 10,000 tugs, towboats, and offshore support vessels, the balance of the United States shallow draft self propelled fleet con- sisting of 11,000 ferries, patrol boats, dredges, pilot boats, fire boats, small harbor tankers, etc. and the number of docu- mented small vessels in the
U.S. self-propelled fleet (5- 1000 gross tons) totals ap- proximately 21,000 draft vessels. shallow-
NOTE: These tables do not include all shallow-draft vessels, i.e. ferries, patrol boats, fire boats, dredges, commercial fishing boats, etc. are not included.
The figures in these shallow draft tables are conservative as it is not possible to obtain data on every tug, towboat and offshore support vessel in the United States fleet (a limited number of smaller and/or individu- ally owned boats may not be in- cluded).
Source: Statistics courtesy of Fleet
Data Service, P. 0. Box 2576, Na- cogdoches, TX 75963. Telephone (409) 569-0375.
Similar tables can be generated on specific segments of the fleet on a custom basis. Contact James O.
Covington, Fleet Data Service,
P. 0. Box 2576, Nacogdoches TX 75963. Telephone (409) 569-0375 for further details of information avail- able.
Statistical Summary
The following statistical tables summarize the 1310 tugs in the active American fleet at the end of 1984.
Three specific vessel types have been identified and tabulated sepa- rately. These are anchor-handling tugs (AT), tugs used with dedicated tug/barge units (IT), and tugs in ship-handling or harbor service (HBR). The remaining 776 tugs are not equipped with deck gear for anchor-handling service, tendering for ship-handling service, or special barge connectors for ITB service.
These 776 tugs are in general towing service.
The inventory has been tabulated by year built and horsepower ranges. It should be noted that these
HP ranges are based upon manufac- turer's ratings for continuous duty. [Tables continue on page 62]
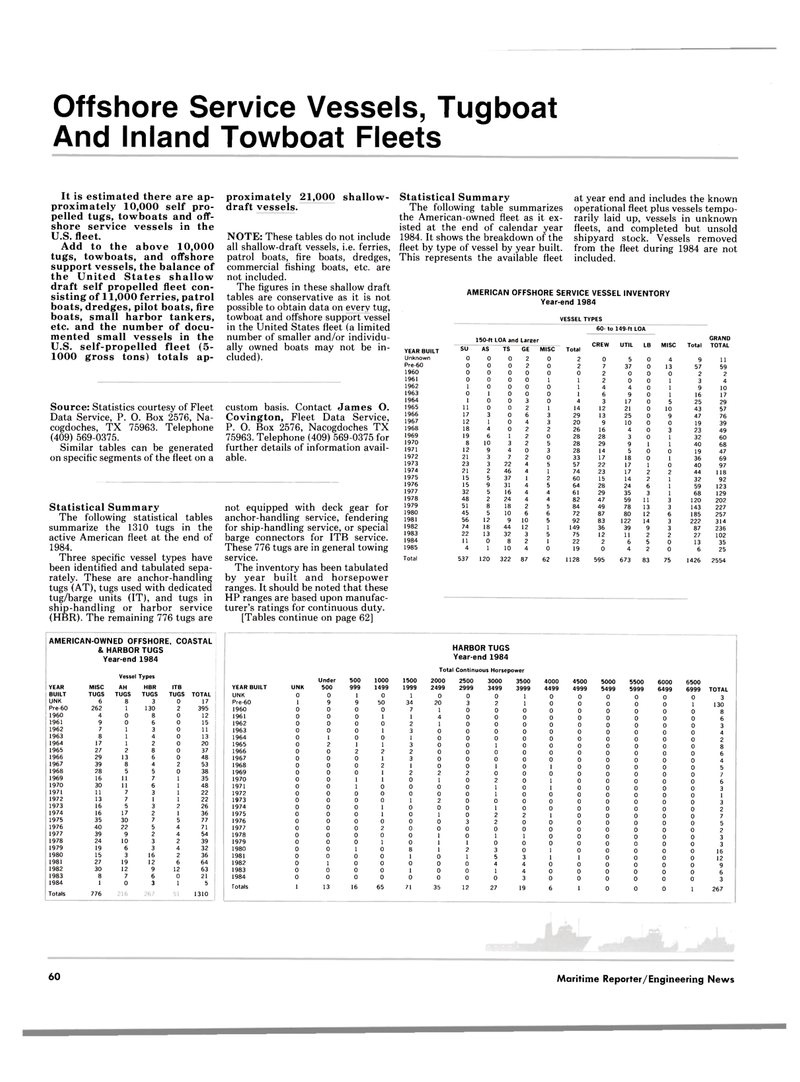
Statistical Summary
The following table summarizes the American-owned fleet as it ex- isted at the end of calendar year 1984. It shows the breakdown of the fleet by type of vessel by year built.
This represents the available fleet at year end and includes the known operational fleet plus vessels tempo- rarily laid up, vessels in unknown fleets, and completed but unsold shipyard stock. Vessels removed from the fleet during 1984 are not included.
AMERICAN OFFSHORE SERVICE VESSEL INVENTORY
Year-end 1984
VESSEL TYPES 60- to 149-ft LOA 150-ft 1 LOA and Lareer
CREW
GRAND su AS TS GE MISC UTIL LB MISC Total TOTAL YEAR BUILT Total
Unknown 0 0 0 2 0 2 0 5 0 4 9 11
Pre-60 0 0 0 2 0 2 7 37 0 13 57 59 1960 0 0 0 0 0 0 2 0 0 0 2 2 1961 0 0 0 0 1 1 2 0 0 1 3 4 1962 1 0 0 0 0 1 4 4 0 1 9 10 1963 0 1 0 0 0 1 6 9 0 1 16 17 1964 1 0 0 3 0 4 3 17 0 5 25 29 1965 11 0 0 2 1 14 12 21 0 10 43 57 1966 17 3 0 6 3 29 13 25 0 9 47 76 1967 12 1 0 4 3 20 9 10 0 0 19 39 1968 18 4 0 2 2 26 16 4 0 3 23 49 1969 19 6 1 2 0 28 28 3 0 1 32 60 1970 8 10 3 2 5 28 29 9 1 1 40 68 1971 12 9 4 0 3 28 14 5 0 0 19 47 1972 21 3 7 2 0 33 17 18 0 1 36 69 1973 23 3 22 4 5 57 22 17 1 0 40 97 1974 21 2 46 4 1 74 23 17 2 2 44 118 1975 15 5 37 1 2 60 15 14 2 1 32 92 1976 15 9 31 4 5 64 28 24 6 1 59 123 1977 32 5 16 4 4 61 29 35 3 1 68 129 1978 48 2 24 4 4 82 47 59 11 3 120 202 1979 51 8 18 2 5 84 49 78 13 3 143 227 1980 45 5 10 6 6 72 87 80 12 6 185 257 1981 56 12 9 10 5 92 83 122 14 3 222 314 1982 74 18 44 12 1 149 36 39 9 3 87 236 1983 22 13 32 3 5 75 12 11 2 2 27 102 1984 11 0 8 2 1 22 2 6 5 0 13 35 1985 4 1 10 4 0 19 0 4 2 0 6 25
Total 537 120 322 87 62 1128 595 673 83 75 1426 2554
AMERICAN-OWNED OFFSHORE, COASTAL & HARBOR TUGS
Year-end 1984
YEAR
BUILT
UNK
Pre-60 1960 1961 1962 1963 1964 1965 1966 1967 1968 1969 1970 1971 1972 1973 1974 1975 1976 1977 1978 1979 1980 1981 1982 1983 1984
Totals
Vessel Types
MISC
TUGS 6 262 4 9 7 8 17 27 29 39 28 16 30 11 13 16 16 35 40 39 24 19 15 27 30 8 1 776
AH
TUGS 8 1 0 0 1 1 1 2 13 8 5 11 11 7 7 5 17 30 22 9 10 6 3 19 12 7 0
HBR
TUGS 3 130 8 6 3 4 2 8 6 4 5 7 6 3 1 3 2 7 5 2 3 3 16 12 9 6 3
ITB
TUGS TOTAL 0 2 0 0 0 0 0 0 0 2 0 1 1 1 1 2 1 5 4 4 2 4 2 6 12 0 1 17 395 12 15 11 13 20 37 48 53 38 35 48 22 22 26 36 77 71 54 39 32 36 64 63 21 5 1310
HARBOR TUGS
Year-end 1984
Total Continuous Horsepower
Under 500 1000 1500 2000 2500 3000 3500 4000 4500 5000 5500 6000 6500
YEAR BUILT UNK 500 999 1499 1999 2499 2999 3499 3999 4499 4999 5499 5999 6499 6999 TOTAL
UNK 0 0 1 0 1 0 0 0 1 0 0 0 0 0 0 3
Pre-60 1 9 9 50 34 20 3 2 1 0 0 0 0 0 1 130 8 1960 0 0 0 0 7 1 0 0 0 0 0 0 0 0 0 1961 0 0 0 1 1 4 0 0 0 0 0 0 0 0 0 6 1962 0 0 0 0 2 1 0 0 0 0 0 0 0 0 0 3 1963 0 0 0 1 3 0 0 0 0 0 0 0 0 0 0 4 1964 0 1 0 0 1 0 0 0 0 0 0 0 0 0 0 2 1965 0 2 1 1 3 0 0 1 0 0 0 0 0 0 0 8 1966 0 0 2 2 2 0 0 0 0 0 0 0 0 0 0 6 1967 0 0 0 1 3 0 0 0 0 0 0 0 0 0 0 4 1968 0 0 0 2 1 0 0 1 0 1 0 0 0 0 0 5 1969 0 0 0 1 2 2 2 0 0 0 0 0 0 0 0 7 1970 0 0 1 1 0 1 0 2 0 1 0 0 0 0 0 6 1971 0 0 1 0 0 0 0 1 0 1 0 0 0 0 0 3 1972 0 0 0 0 0 0 0 1 0 0 0 0 0 0 0 1 1973 0 0 0 0 1 2 0 0 0 0 0 0 0 0 0 3 1974 0 0 0 1 0 0 0 1 0 0 0 0 0 0 0 2 1975 0 0 0 1 0 1 0 2 2 1 0 0 0 0 0 7 1976 0 0 0 0 0 0 3 2 0 0 0 0 0 0 0 5 1977 0 0 0 2 0 0 0 0 0 0 0 0 0 0 0 2 1978 0 0 0 0 0 1 0 1 1 0 0 0 0 0 0 3 1979 0 0 0 1 0 1 1 0 0 0 0 0 0 0 0 3 1980 0 0 1 0 8 1 2 3 0 1 0 0 0 0 0 16 1981 0 0 0 0 1 0 1 5 3 1 1 0 0 0 0 12 1982 0 1 0 0 0 0 0 4 4 0 0 0 0 0 0 9 1983 0 0 0 0 1 0 0 1 4 0 0 0 0 0 0 6 1984 0 0 0 0 0 0 0 0 3 0 0 0 0 0 0 3
Totals 1 13 16 65 /I 35 12 27 19 6 1 0 0 0 1 267 60 Maritime Reporter/Engineering News
