Page 24: of Maritime Reporter Magazine (July 1989)
Read this page in Pdf, Flash or Html5 edition of July 1989 Maritime Reporter Magazine
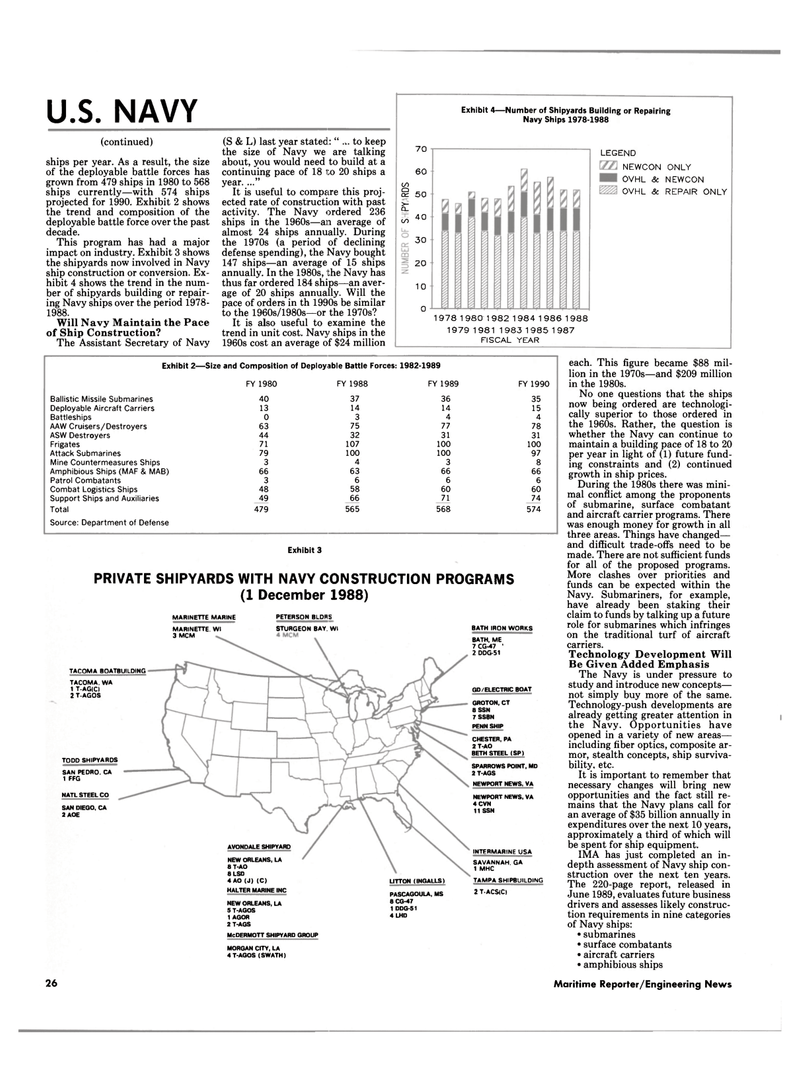
U.S. NAVY (continued) ships per year. As a result, the size of the deployable battle forces has grown from 479 ships in 1980 to 568 ships currently—with 574 ships projected for 1990. Exhibit 2 shows the trend and composition of the deployable battle force over the past decade.
This program has had a major impact on industry. Exhibit 3 shows the shipyards now involved in Navy ship construction or conversion. Ex- hibit 4 shows the trend in the num- ber of shipyards building or repair- ing Navy ships over the period 1978- 1988.
Will Navy Maintain the Pace of Ship Construction?
The Assistant Secretary of Navy (S & L) last year stated: " .v. to keep the size of Navy we are talking about, you would need to build at a continuing pace of 18 to 20 ships a year. ..."
It is useful to compare this proj- ected rate of construction with past activity. The Navy ordered 236 ships in the 1960s—an average of almost 24 ships annually. During the 1970s (a period of declining defense spending), the Navy bought 147 ships—an average of 15 ships annually. In the 1980s, the Navy has thus far ordered 184 ships—an aver- age of 20 ships annually. Will the pace of orders in th 1990s be similar to the 1960s/1980s—or the 1970s?
It is also useful to examine the trend in unit cost. Navy ships in the 1960s cost an average of $24 million
Exhibit 4—Number of Shipyards Building or Repairing
Navy Ships 1978-1988 70 60 oo § 50 >-
CL cn 40 30 20 10 0
LEGEND
NEWCON ONLY
OVHL & NEWCON
OVHL & REPAIR ONLY 19781980 19821984 1 986 1 988 1979 1981 1983 1985 1987
FISCAL YEAR
Exhibit 2— -Size and Composition of Deploy able Battle Forces: 1982-1989
FY 1980 FY 1988 FY 1989 FY 1990
Ballistic Missile Submarines 40 37 36 35
Deployable Aircraft Carriers 13 14 14 15
Battleships 0 3 4 4
AAW Cruisers/Destroyers 63 75 77 78
ASW Destroyers 44 32 31 31
Frigates 71 107 100 100
Attack Submarines 79 100 100 97
Mine Countermeasures Ships 3 4 3 8
Amphibious Ships (MAF & MAB) 66 63 66 66
Patrol Combatants 3 6 6 6
Combat Logistics Ships 48 58 60 60
Support Ships and Auxiliaries 49 66 71 74
Total 479 565 568 574
Source: Department of Defense
Exhibit 3
PRIVATE SHIPYARDS WITH NAVY CONSTRUCTION PROGRAMS (1 December 1988)
MARINETTE MARINE PETERSON BLDRS
McDERMOTT SHIPYARD GROUP
MORGAN CITY, LA 4 T-AGOS (SWATH) each. This figure became $88 mil- lion in the 1970s—and $209 million in the 1980s.
No one questions that the ships now being ordered are technologi- cally superior to those ordered in the 1960s. Rather, the question is whether the Navy can continue to maintain a building pace of 18 to 20 per year in light of (1) future fund- ing constraints and (2) continued growth in ship prices.
During the 1980s there was mini- mal conflict among the proponents of submarine, surface combatant and aircraft carrier programs. There was enough money for growth in all three areas. Things have changed— and difficult trade-offs need to be made. There are not sufficient funds for all of the proposed programs.
More clashes over priorities and funds can be expected within the
Navy. Submariners, for example, have already been staking their claim to funds by talking up a future role for submarines which infringes on the traditional turf of aircraft carriers.
Technology Development Will
Be Given Added Emphasis
The Navy is under pressure to study and introduce new concepts— not simply buy more of the same.
Technology-push developments are already getting greater attention in the Navy. Opportunities have opened in a variety of new areas— including fiber optics, composite ar- mor, stealth concepts, ship surviva- bility, etc.
It is important to remember that necessary changes will bring new opportunities and the fact still re- mains that the Navy plans call for an average of $35 billion annually in expenditures over the next 10 years, approximately a third of which will be spent for ship equipment. iMA has just completed an in- depth assessment of Navy ship con- struction over the next ten years.
The 220-page report, released in
June 1989, evaluates future business drivers and assesses likely construc- tion requirements in nine categories of Navy ships: • submarines • surface combatants • aircraft carriers • amphibious ships
LITTON (INGALLS)
PASCAGOULA, MS 8 CG-47 1 DDG-51 4 LHD
BATH IRON WORKS
BATH, ME 7 CG-47 1 2 DDG-51
GD/ELECTRIC BOAT
GROTON, CT 8 SSN 7SSBN
PENN SHIP
CHESTER, PA 2 T-AO
BETH STEEL (SP)
SPARROWS POINT, MD 2 T-AGS
NEWPORT NEWS, VA
NEWPORT NEWS, VA 4 CVN 11 SSN
INTERMARINE USA
SAVANNAH. GA 1 MHC
TAMPA SHIPBUILDING 2 T-ACS(C)
AVONDALE SHIPYARD
NEW ORLEANS, LA 8T-A0 8 LSD 4 AO (J) (C)
HALTER MARINE INC
NEW ORLEANS, LA 5 T-AGOS 1 AGOR 2 T-AGS
TACQMA BOATBUILDING
TACOMA. WA 1 T-AG(C) 2 T-AGOS
TODD SHIPYARDS
SAN PEDRO. CA 1 FFG
NATL STEEL CO
SAN DIEGO, CA 2 AOE
MARINETTE. Wl 3 MCM
STURGEON BAY. Wl 26 Maritime Reporter/Engineering News

 23
23

 25
25
