Page 16: of Maritime Reporter Magazine (December 1990)
Read this page in Pdf, Flash or Html5 edition of December 1990 Maritime Reporter Magazine
 15
15
 17
17
MARITIME 2000
Survey Reveals Recovery
Of Small- And Medium-Sized Yards 1984, employment has gradually in- creased each year until dropping again in 1988 to a level of 11,424.
Then, in 1989, there was a 15 per- cent increase in employment.
Table 1.—Employment Levels in Second Tier Shipyards (1980-1989)
Year # of Employees 1980 21,638 1981 24.699 1982 17,570 1983 12,590 1984 11,393 1985 11,608 1986 12,366 1987 12,454 1988 11,424 1989 13.478
The American Waterways Ship- yard Conference (AWSC), a confer- ence within The American Water- ways Operators, represents the in- terests of the small- and medium- sized or "second-tier" yards in the shipbuilding and repair industry.
These yards build and repair the tugboats, towboats and barges for the domestic water transportation industry; the supply boats, crew- boats, and other specialized vessels for the offshore service industry; and a wide variety of fishing vessels.
They are also typically responsible for the construction and repair of the Navy's smaller vessels, the
Coast Guard fleet, and vessels oper- ated by the Army Corps of Engi- neers and NOAA.
In order to develop an accurate statistical profile of the industry, which can be utilized to identify trends for use in legislative and reg- ulatory issues which affect second- tier shipyards, this survey has been conducted under the auspices of the
Economic and Commercial Com- mittee of the American Waterways
Shipyard Conference.
Information on employment, new construction, and repair activities for this survey were compiled on a voluntary basis from approximately 250 second-tier shipyard facilities, and includes data from the years 1980 to 1989. The American Water- ways Shipyard Conference is the only association which collects this type of information for the second tier of the shipbuilding industry.
Employment Trends
The "Employment Information and Trends" section of the survey contains information on activities directly related to employment in the shipyard facility.
Graph 1
Tiouu* Employment Levels
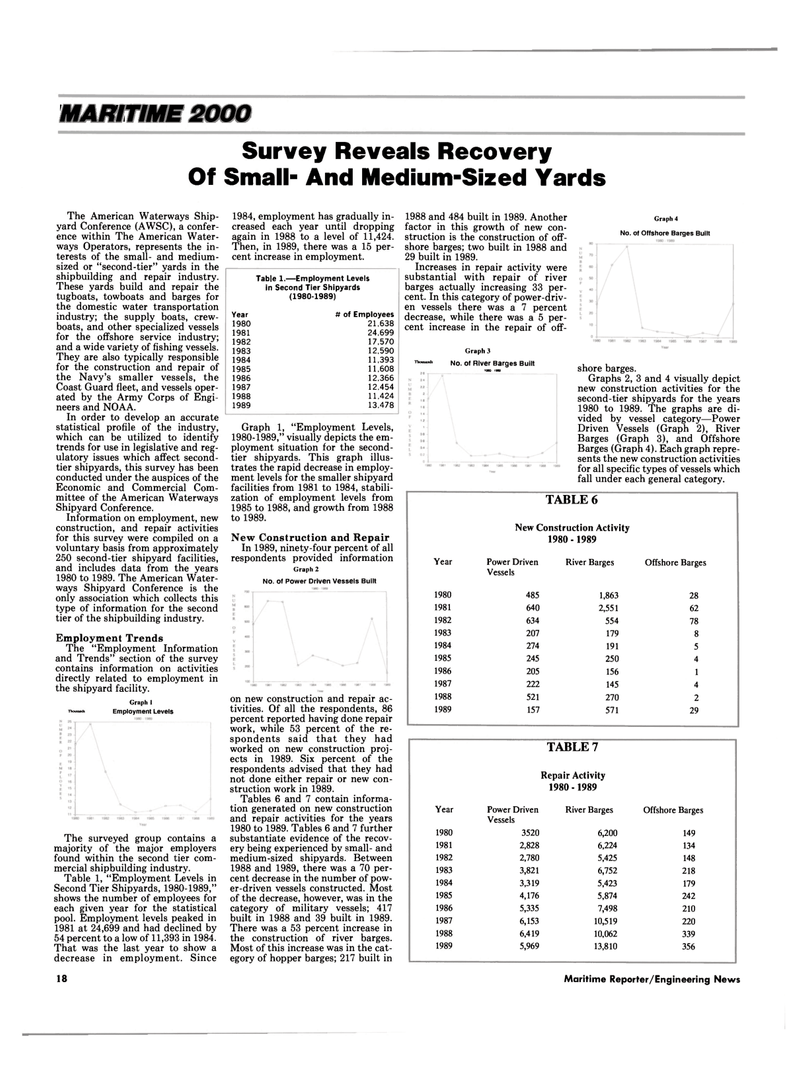
The surveyed group contains a majority of the major employers found within the second tier com- mercial shipbuilding industry.
Table 1, "Employment Levels in
Second Tier Shipyards, 1980-1989," shows the number of employees for each given year for the statistical pool. Employment levels peaked in 1981 at 24,699 and had declined by 54 percent to a low of 11,393 in 1984.
That was the last year to show a decrease in employment. Since
Graph 1, "Employment Levels, 1980-1989," visually depicts the em- ployment situation for the second- tier shipyards. This graph illus- trates the rapid decrease in employ- ment levels for the smaller shipyard facilities from 1981 to 1984, stabili- zation of employment levels from 1985 to 1988, and growth from 1988 to 1989.
New Construction and Repair
In 1989, ninety-four percent of all respondents provided information
Graph 2
No. of Power Driven Vessels Built on new construction and repair ac- tivities. Of all the respondents, 86 percent reported having done repair work, while 53 percent of the re- spondents said that they had worked on new construction proj- ects in 1989. Six percent of the respondents advised that they had not done either repair or new con- struction work in 1989.
Tables 6 and 7 contain informa- tion generated on new construction and repair activities for the years 1980 to 1989. Tables 6 and 7 further substantiate evidence of the recov- ery being experienced by small- and medium-sized shipyards. Between 1988 and 1989, there was a 70 per- cent decrease in the number of pow- er-driven vessels constructed. Most of the decrease, however, was in the category of military vessels; 417 built in 1988 and 39 built in 1989.
There was a 53 percent increase in the construction of river barges.
Most of this increase was in the cat- egory of hopper barges; 217 built in 1988 and 484 built in 1989. Another factor in this growth of new con- struction is the construction of off- shore barges; two built in 1988 and 29 built in 1989.
Increases in repair activity were substantial with repair of river barges actually increasing 33 per- cent. In this category of power-driv- en vessels there was a 7 percent decrease, while there was a 5 per- cent increase in the repair of off-
Graph 3 t*""""1" No. of River Barges Built
ISM) 1963
Graph 4
No. of Offshore Barges Built shore barges.
Graphs 2, 3 and 4 visually depict new construction activities for the second-tier shipyards for the years 1980 to 1989. The graphs are di- vided by vessel category—Power
Driven Vessels (Graph 2), River
Barges (Graph 3), and Offshore
Barges (Graph 4). Each graph repre- sents the new construction activities for all specific types of vessels which fall under each general category.
TABLE 6
New Construction Activity 1980 - 1989
Year Power Driven
Vessels
River Barges Offshore Barges 1980 485 1,863 28 1981 640 2,551 62 1982 634 554 78 1983 207 179 8 1984 274 191 5 1985 245 250 4 1986 205 156 1 1987 222 145 4 1988 521 270 2 1989 157 571 29
TABLE 7
Repair Activity 1980 - 1989
Year Power Driven
Vessels
River Barges Offshore Barges 1980 3520 6,200 149 1981 2,828 6,224 134 1982 2,780 5,425 148 1983 3,821 6,752 218 1984 3,319 5,423 179 1985 4,176 5,874 242 1986 5,335 7,498 210 1987 6,153 10,519 220 1988 6,419 10,062 339 1989 5,969 13,810 356 18 Maritime Reporter/Engineering News
