
Page 24: of Maritime Reporter Magazine (June 1991)
Read this page in Pdf, Flash or Html5 edition of June 1991 Maritime Reporter Magazine
 23
23
 25
25
WORLD SHIPBUILDING * REPAIR
Ship Construction Surge To Continue Into '90s
Ship Repair, Conversion Market To Rise As Well
Overview
In the second half of 1990, the resurgence of world shipbuilding showed a slight drop-off from the record levels of new construction in the two previous years. For the most part, this was due to the uncer- tain atmosphere created by the Gulf
War and the world economic reces- sion.
Some analysts, however, believe that this downturn is only a "hiccup" in a continuing improving market.
U.K. shipbuilder Harland &
Wolff, for example, is very optimis- tic about the outlook for shipbuild- ing, which it feels will be spurred by replacement of an aging world fleet and the new U.S. Oil Pollution Act.
T. John Parker, the chairman of
Harland & Wolff Holdings pic, has been quoted as saying prospects should be good for the next 10 years, as shipowners are forced to upgrade and replace old tonnage. He be- lieves that now that the Persian
Gulf War has been settled, "... we can move into the post-Saddam era of more sensible planning."
Total gross tonnage ordered in 1990 showed a 25 percent increase on the 1989 figures—which in turn were substantially higher than the previous year. Annual new orders rose from 12.3 million gross tons (gt) in 1988 to 19.3 million gt in 1989 to 24.1 million gt last year. However, the majority of this 1990 record ordering came within the first half of the year, but there were already signs of waning confidence by the start of the Gulf Crisis—after which orders fell off dramatically. Never- theless, many shipyards have es- tablished relatively good orderbooks for the next two years.
Despite the record ordering, there appears to have been capacity for receiving more orders in 1990. So me yards may have held back from new orders to keep contract prices high: a VLCC's newbuilding cost peaked mid-year at around $93 million, and ended the year around $90 million, which was up $20 million on end- 1988 figures.
To no one's surprise, of the 24.1 million gt of new orders, Japanese and South Korean shipyards in- creased their market share to 70 percent, with Korea recording 5.7 million gt in new orders.— 79 per- cent greater than 1989. The record
Korean tonnage was due to improved industrial relations with its ship- building industry. The reported value of Korean tonnage ordered was nearly $4 billion, more than double that of two years ago.
Japan, although maintaining the largest percentage, was only able to increase its new order tonnage to 11.1 million gt, a 15.8 percent in- crease on 1989. This suggests that the large rise in 1989 had taken up much of the country's existing spare capacity, which was limited because a skilled labor shortage had slowed down reactivation of mothballed yards.
Worldwide, the 4.8 million gt rise in orders over 1989 consisted almost entirely of oil tanker tonnage. The 13.8 million gt of tanker orders was almost double 1989 orders, and for the only time in the last 10 years ac- counted for over 50 percent of the total gross tonnage ordered.
In contrast, dry bulk orders, after a rise in total gross tonnage ordered over the previous three years, fell back to below 1988 levels. This slowdown was particularly influ- enced by falling charter rates in 1990. General cargo and container orders continued to rise slowly.
Shipyards in the U.S. continued to rely on U.S. Navy ship construc- tion, with about $24 billion budg- eted for the building of 33 ships for the fiscal years of 1991-1993.
Major news on the commercial side, was the $75 million conversion of the cruise ship Viking Serenade, the largest export order for the U.S. in a number of years, and the order for two molten sulfur tankers for a
U.S. owner.
On the other hand, over the last several years, smaller U.S. yards have experienced a surge in com- mercial activity, with several sup- ply and work boat, passenger vessel and casino riverboat orders.
Record Total
Orderbook In '90
The substantial increase in or- ders in 1990 resulted in a record end-of-year total orderbook of nearly 40 million gt—a near doubling in four years. Though obviously en- couraging, the increase from 1989 of 9 million gt also reflects the difficul- ties which yards have experienced in keeping pace with new orders. 20 Percent Rise
In Completions
The turnaround that occurred in 1989 of the total annual comple- tions after a four-year decline was boosted by a further 20 percent rise in 1990. The total of 15.9 million gt, however, remained over 2 million gt below 1984-85, the highest of the 1980s.
Whereas new orders placed in 1990 were dominated by tankers, the proportion of completion ac- counted for by tankers remained at 5 million gt. In contrast, dry bulk carrier completions of 5.5 million gt represented a rise of 42.5 percent over 1989 figures, and general cargo/ container ship completions a rise of 34 percent. This will significantly affect the composition of the world orderbook, which will once again be dominated by tanker tonnage. (continued)
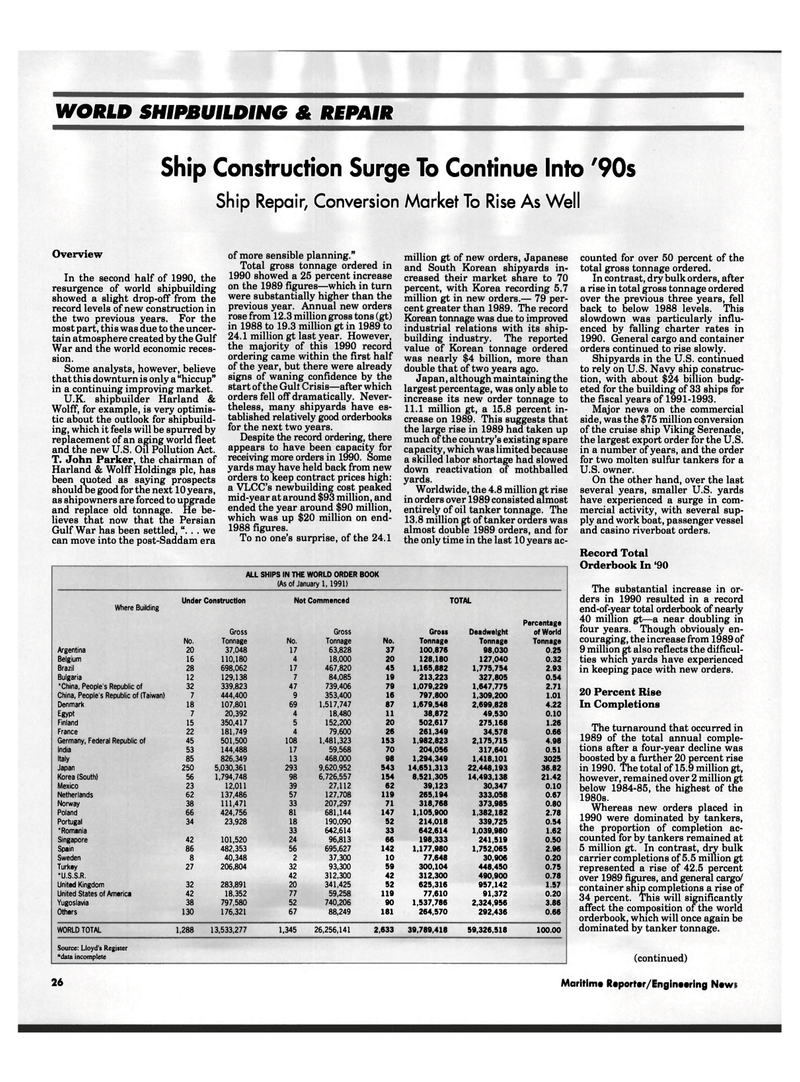
ALL SHIPS IN THE WORLD ORDER BOOK (As of January 1,1991)
Under Construction Not Commenced TOTAL
Where Building
Percentage
Gross Gross Gross Deadweight of World
No. Tonnage No. Tonnage No. Tonnage Tonnage Tonnage
Argentina 20 37,048 17 63,828 37 100,876 98,030 0.25
Belgium 16 110,180 4 18,000 20 128,180 127,040 0.32
Brazil 28 698,062 17 467,820 45 1,165,882 1,775,754 2.93
Bulgaria 12 129,138 7 84,085 19 213,223 327,805 0.54 "China, People's Republic of 32 339,823 47 739,406 79 1,079,229 1,647,775 2.71
China, People's Republic of (Taiwan) 7 444,400 9 353,400 16 797,800 1,309,200 1.01
Denmark 18 107,801 69 1,517,747 87 1,679,548 2,699,828 4.22
Egypt 7 20,392 4 18,480 11 38,872 49,530 0.10
Finland 15 350,417 5 152,200 20 502,617 275,168 1.26
France 22 181,749 4 79,600 26 261,349 34,578 0.66
Germany, Federal Republic of 45 501,500 108 1,481,323 153 1,982,823 2,175,715 4.98
India 53 144,488 17 59,568 70 204,056 317,640 0.51
Italy 85 826,349 13 468,000 98 1,294,349 1,418,101 3025
Japan 250 5,030,361 293 9,620,952 543 14,651,313 22,448,193 36.82
Korea (South) 56 1,794,748 98 6,726,557 154 8,521,305 14,493,138 21.42
Mexico 23 12,011 39 27,112 62 39,123 30,347 0.10
Netherlands 62 137,486 57 127,708 119 265,194 333,058 0.67
Norway 38 111,471 33 207,297 71 318,768 373,985 0.80
Poland 66 424,756 81 681,144 147 1,105,900 1,382,182 2.78
Portugal 34 23,928 18 190,090 52 214,018 339,725 0.54 •Romania 33 642,614 33 642,614 1,039,980 1.62
Singapore 42 101,520 24 96,813 66 198,333 241,519 0.50
Spain 86 482,353 56 695,627 142 1,177,980 1,752,065 2.96
Sweden 8 40,348 2 37,300 10 77,648 30,906 0.20
Turkey 27 206,804 32 93,300 59 300,104 448,450 0.75 •U.S.S.R. 42 312,300 42 312,300 490,900 0.78
United Kingdom 32 283,891 20 341,425 52 625,316 957,142 1.57
United States of America 42 18,352 77 59,258 119 77,610 91,372 0.20
Yugoslavia 38 797,580 52 740,206 90 1,537,786 2,324,956 3.86
Others 130 176,321 67 88,249 181 264,570 292,436 0.66
WORLD TOTAL 1,288 13,533,277 1,345 26,256,141 2,633 39,789,418 59,326,518 100.00
Source: Lloyd's Register •data incomplete 26 Maritime Reporter/Engineering News
