Page 80: of Maritime Reporter Magazine (June 1992)
Read this page in Pdf, Flash or Html5 edition of June 1992 Maritime Reporter Magazine
INTEGRATED CHEMICAL TRANSPORTATION
Crisis Of Age, Quality & Money In Parcel Tanker Fleet
Quality Owners Invest In New Construction, Ship Life Extension
By David G. Palmer, Senior Vice President,
Group Marketing, Stolt-Nielsen, Inc. 'T'here is a crisis of age, quality and money heading in the direction of the parcel tanker in- dustry.
The fleet is rapidly aging. The industry has embarked on a period of patch and mend—nurturing an old fleet. Unfortunately the value that can be achieved through life extension is approaching the value from newbuildings, and neither are supported by the current market.
Only the quality owners are put- ting money into life extension, in order to maintain the quality of their fleets. The second-tier own- ers are letting their standards drop and are switching to less intensive trades.
Let's try to bring the parcel tanker into the 21st century. What are the implications of the crisis on our customers? Should they change their methods of contracting and make more value-oriented, inte- grated decisions when working with logistics operators?
I believe so. First, let's take a snapshot of the whole chemical fleet.
Chemical Tanker Fleet
As you can see from Chart 1, as of
September 1991, there were 1,104 ships of 14.5 million dwt with IMO chemical certification trade world- wide. They range in size from 1,500 to 50,000 dwt. Of these, 40 percent are considered sophisticated and 60 percent are simple.
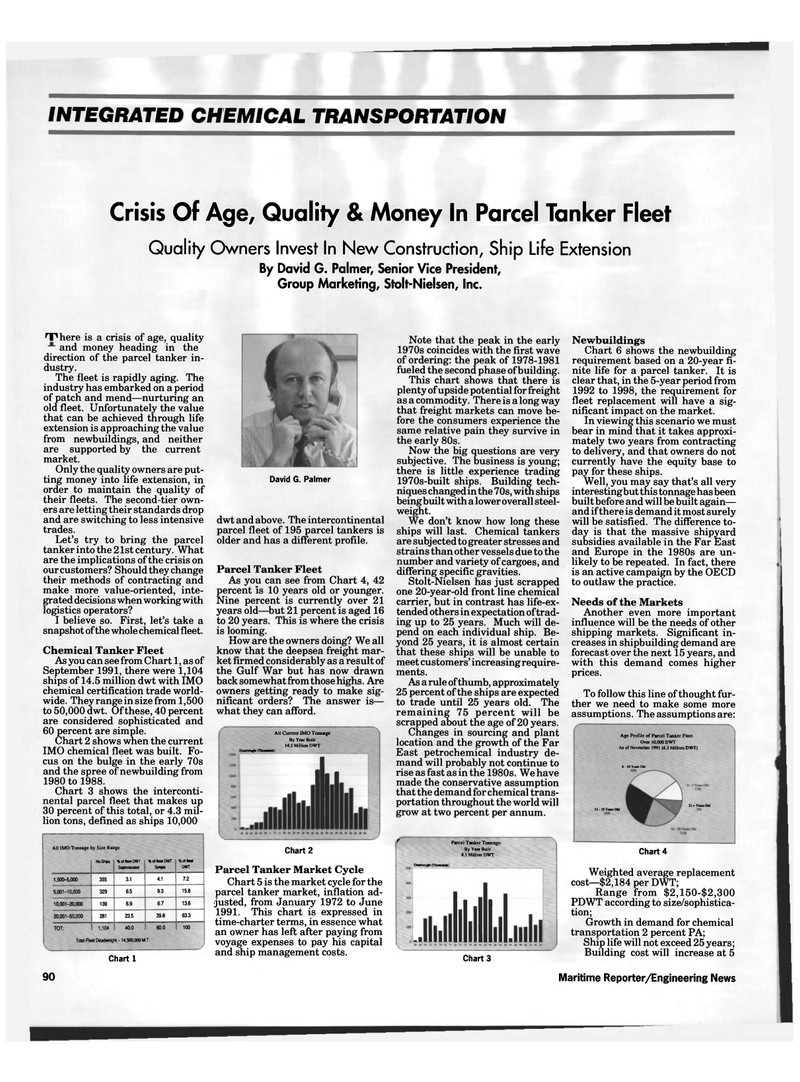
Chart 2 shows when the current
IMO chemical fleet was built. Fo- cus on the bulge in the early 70s and the spree of newbuilding from 1980 to 1988.
Chart 3 shows the interconti- nental parcel fleet that makes up 30 percent of this total, or 4.3 mil- lion tons, defined as ships 10,000
All IMO Tonnage by Size Range
No.Stiips %otfleet DWT
Sophisticated %otfleet DWT
Simple \ot fleet
DWT 1,500-5,000 355 3.1 4.1 7.2 5,001-10,000 329 6.5 9.3 15-8 10,001-20,000 139 6.9 6.7 13.6 20,001-50,000 281 23.5 39.8 63.3
TOT: 1,104 40.0 60.0 100
Total Reel Deadweight -14,500,000 M.T.
David G. Palmer dwt and above. The intercontinental parcel fleet of 195 parcel tankers is older and has a different profile.
Parcel Tanker Fleet
As you can see from Chart 4, 42 percent is 10 years old or younger.
Nine percent is currently over 21 years old—but 21 percent is aged 16 to 20 years. This is where the crisis is looming.
How are the owners doing? We all know that the deepsea freight mar- ket firmed considerably as a result of the Gulf War but has now drawn back somewhat from those highs. Are owners getting ready to make sig- nificant orders? The answer is— what they can afford.
All Current IMO Tonnage
By Year Built 14.5 Million DWT
DudraglM Cnom—k)
Chart 1
Chart 2
Parcel Tanker Market Cycle
Chart 5 is the market cycle for the parcel tanker market, inflation ad- justed, from January 1972 to June 1991. This chart is expressed in time-charter terms, in essence what an owner has left after paying from voyage expenses to pay his capital and ship management costs.
Note that the peak in the early 1970s coincides with the first wave of ordering: the peak of 1978-1981 fueled the second phase of building.
This chart shows that there is plenty of upside potential for freight as a commodity. There is a long way that freight markets can move be- fore the consumers experience the same relative pain they survive in the early 80s.
Now the big questions are very subjective. The business is young; there is little experience trading 1970s-built ships. Building tech- niques changed in the 70s, with ships beingbuiltwithalower overall steel- weight.
We don't know how long these ships will last. Chemical tankers are subjected to greater stresses and strains than other vessels due to the number and variety of cargoes, and differing specific gravities.
Stolt-Nielsen has just scrapped one 20-year-old front line chemical carrier, but in contrast has life-ex- tended others in expectation of trad- ing up to 25 years. Much will de- pend on each individual ship. Be- yond 25 years, it is almost certain that these ships will be unable to meet customers' increasing require- ments.
As a rule of thumb, approximately 25 percent of the ships are expected to trade until 25 years old. The remaining 75 percent will be scrapped about the age of 20 years.
Changes in sourcing and plant location and the growth of the Far
East petrochemical industry de- mand will probably not continue to rise as fast as in the 1980s. We have made the conservative assumption that the demand for chemical trans- portation throughout the world will grow at two percent per annum. r~ Parcel Tanker Tonnage
By Year Built 4.3 Million DWT
Deadweight (Thousands)
Newbuildings
Chart 6 shows the newbuilding requirement based on a 20-year fi- nite life for a parcel tanker. It is clear that, in the 5-year period from 1992 to 1998, the requirement for fleet replacement will have a sig- nificant impact on the market.
In viewing this scenario we must bear in mind that it takes approxi- mately two years from contracting to delivery, and that owners do not currently have the equity base to pay for these ships.
Well, you may say that's all very interesting but this tonnage has been built before and will be built again— and if there is demand it most surely will be satisfied. The difference to- day is that the massive shipyard subsidies available in the Far East and Europe in the 1980s are un- likely to be repeated. In fact, there is an active campaign by the OECD to outlaw the practice.
Needs of the Markets
Another even more important influence will be the needs of other shipping markets. Significant in- creases in shipbuilding demand are forecast over the next 15 years, and with this demand comes higher prices.
To follow this line of thought fur- ther we need to make some more assumptions. The assumptions are:
Age Profile of Parcel Tanker Fleet
Over 10,000 DWT
As of November 1991 (4.3 Million DWT) 6 10 Y.m Old
It- ISYanOU 21. Vein Old
Chart 3
Chart 4
Weighted average replacement cost—$2,184 per DWT;
Range from $2,150-$2,300
PDWT according to size/sophistica- tion;
Growth in demand for chemical transportation 2 percent PA;
Ship life will not exceed 25 years;
Building cost will increase at 5 90 Maritime Reporter/Engineering News

 79
79

 81
81
