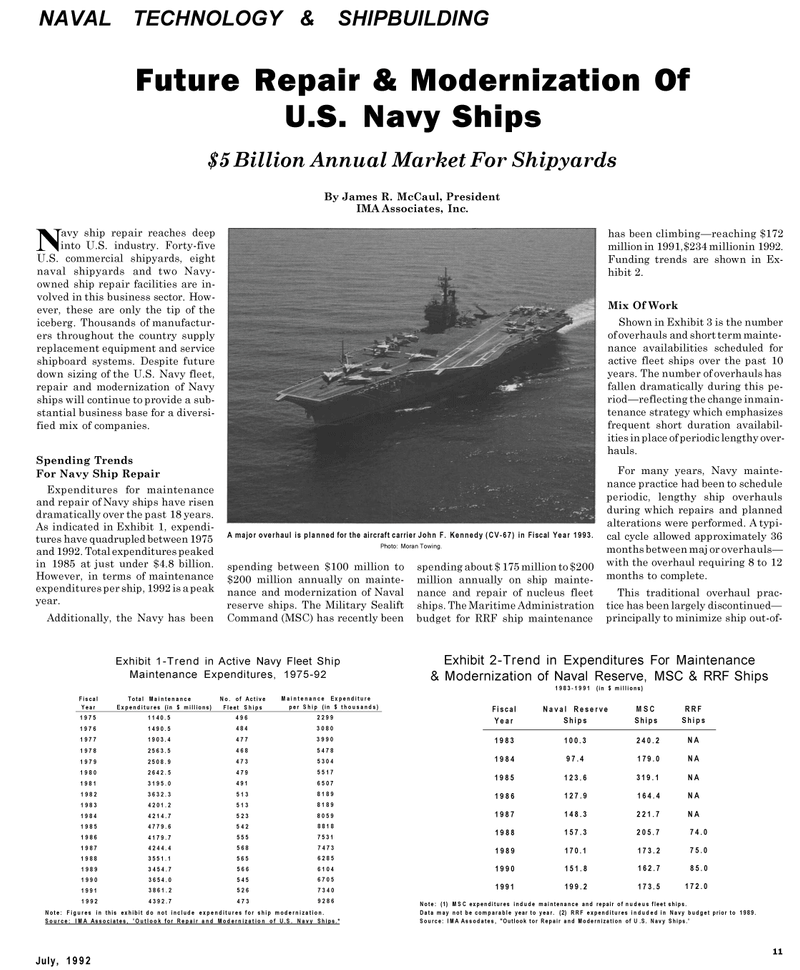
Page 37: of Maritime Reporter Magazine (July 1992)
Read this page in Pdf, Flash or Html5 edition of July 1992 Maritime Reporter Magazine
NAVAL TECHNOLOGY & SHIPBUILDING
Future Repair & Modernization Of
U.S. Navy Ships $5 Billion Annual Market For Shipyards
By James R. McCaul, President
IMA Associates, Inc.
A major overhaul is planned for the aircraft carrier John F. Kennedy (CV-67) in Fiscal Year 1993.
Photo: Moran Towing.
Navy ship repair reaches deep into U.S. industry. Forty-five
U.S. commercial shipyards, eight naval shipyards and two Navy- owned ship repair facilities are in- volved in this business sector. How- ever, these are only the tip of the iceberg. Thousands of manufactur- ers throughout the country supply replacement equipment and service shipboard systems. Despite future down sizing of the U.S. Navy fleet, repair and modernization of Navy ships will continue to provide a sub- stantial business base for a diversi- fied mix of companies.
Spending Trends
For Navy Ship Repair
Expenditures for maintenance and repair of Navy ships have risen dramatically over the past 18 years.
As indicated in Exhibit 1, expendi- tures have quadrupled between 1975 and 1992. Total expenditures peaked in 1985 at just under $4.8 billion.
However, in terms of maintenance expenditures per ship, 1992 is a peak year.
Additionally, the Navy has been spending between $100 million to $200 million annually on mainte- nance and modernization of Naval reserve ships. The Military Sealift
Command (MSC) has recently been spending about $ 175 million to $200 million annually on ship mainte- nance and repair of nucleus fleet ships. The Maritime Administration budget for RRF ship maintenance has been climbing—reaching $172 million in 1991,$234 millionin 1992.
Funding trends are shown in Ex- hibit 2.
Mix Of Work
Shown in Exhibit 3 is the number of overhauls and short term mainte- nance availabilities scheduled for active fleet ships over the past 10 years. The number of overhauls has fallen dramatically during this pe- riod—reflecting the change inmain- tenance strategy which emphasizes frequent short duration availabil- ities in place of periodic lengthy over- hauls.
For many years, Navy mainte- nance practice had been to schedule periodic, lengthy ship overhauls during which repairs and planned alterations were performed. A typi- cal cycle allowed approximately 36 months between maj or overhauls— with the overhaul requiring 8 to 12 months to complete.
This traditional overhaul prac- tice has been largely discontinued— principally to minimize ship out-of-
Exhibit 1-Trend in Active Navy Fleet Ship
Maintenance Expenditures, 1975-92
Fiscal
Year
Total Maintenance
Expenditures (in $ millions)
No. of Active
Fleet Ships
Maintenance Expenditure per Ship (in $ thousands) 1975 1140.5 496 2299 1976 1490.5 484 3080 1977 1903.4 477 3990 1978 2563.5 468 5478 1979 2508.9 473 5304 1980 2642.5 479 5517 1981 3195.0 491 6507 1982 3632.3 513 8189 1983 4201.2 513 8189 1984 4214.7 523 8059 1985 4779.6 542 8818 1986 4179.7 555 7531 1987 4244.4 568 7473 1988 3551.1 565 6285 1989 3454.7 566 6104 1990 3654.0 545 6705 1991 3861.2 526 7340 1992 4392.7 473 9286
Note: Figures in this exhibit do not include expenditures for ship modernization.
Source: IMA Associates, 'Outlook for Repair and Modernization of U.S. Navy Ships.*
Exhibit 2-Trend in Expenditures For Maintenance & Modernization of Naval Reserve, MSC & RRF Ships 1983-1991 (in $ millions)
Fiscal
Year
Naval Reserve
Ships
MSC
Ships
RRF
Ships 1983 100.3 240.2 NA 1984 97.4 179.0 NA 1985 123.6 319.1 NA 1986 127.9 164.4 NA 1987 148.3 221.7 NA 1988 157.3 205.7 74.0 1989 170.1 173.2 75.0 1990 151.8 162.7 85.0 1991 199.2 173.5 172.0
Note: (1) MSC expenditures indude maintenance and repair of nudeus fleet ships.
Data may not be comparable year to year. (2) RRF expenditures induded in Navy budget prior to 1989.
Source: IMA Assodates, "Outlook tor Repair and Modernization of U .S. Navy Ships.'
July, 1992 11

 36
36

 38
38
