
Page 69: of Maritime Reporter Magazine (October 1992)
Read this page in Pdf, Flash or Html5 edition of October 1992 Maritime Reporter Magazine
 68
68
 70
70
third is under 10 years. A handful of vessels date from the 1800's.
Recent Vessel
Construction Activity
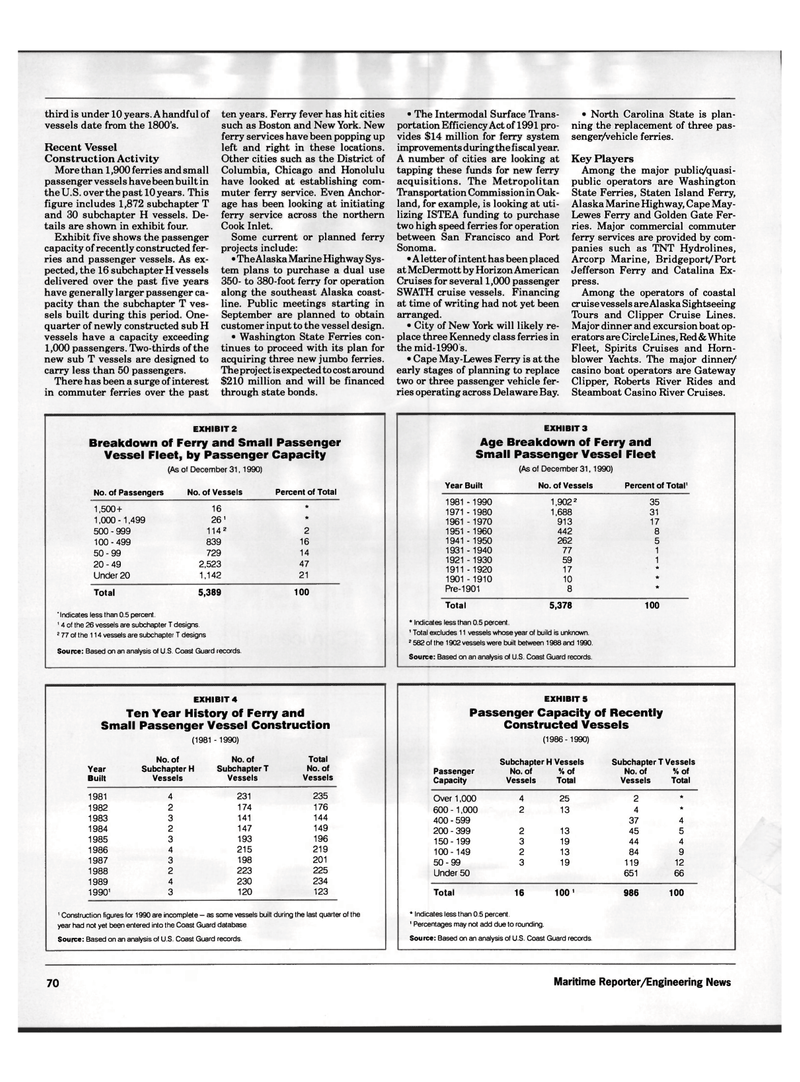
More than 1,900 ferries and small passenger vessels have been built in the U.S. over the past 10 years. This figure includes 1,872 subchapter T and 30 subchapter H vessels. De- tails are shown in exhibit four.
Exhibit five shows the passenger capacity of recently constructed fer- ries and passenger vessels. As ex- pected, the 16 subchapter H vessels delivered over the past five years have generally larger passenger ca- pacity than the subchapter T ves- sels built during this period. One- quarter of newly constructed sub H vessels have a capacity exceeding 1,000 passengers. Two-thirds of the new sub T vessels are designed to carry less than 50 passengers.
There has been a surge of interest in commuter ferries over the past ten years. Ferry fever has hit cities such as Boston and New York. New ferry services have been popping up left and right in these locations.
Other cities such as the District of
Columbia, Chicago and Honolulu have looked at establishing com- muter ferry service. Even Anchor- age has been looking at initiating ferry service across the northern
Cook Inlet.
Some current or planned ferry projects include: • The Alaska Marine Highway Sys- tem plans to purchase a dual use 350- to 380-foot ferry for operation along the southeast Alaska coast- line. Public meetings starting in
September are planned to obtain customer input to the vessel design. • Washington State Ferries con- tinues to proceed with its plan for acquiring three new jumbo ferries.
The proj ect is expected to cost around $210 million and will be financed through state bonds. • The Intermodal Surface Trans- portation Efficiency Act of 1991 pro- vides $14 million for ferry system improvements during the fiscal year.
A number of cities are looking at tapping these funds for new ferry acquisitions. The Metropolitan
Transportation Commission in Oak- land, for example, is looking at uti- lizing ISTEA funding to purchase two high speed ferries for operation between San Francisco and Port
Sonoma. • A letter of intent has been placed at McDermott by Horizon American
Cruises for several 1,000 passenger
SWATH cruise vessels. Financing at time of writing had not yet been arranged. • City of New York will likely re- place three Kennedy class ferries in the mid-1990s. • Cape May-Lewes Ferry is at the early stages of planning to replace two or three passenger vehicle fer- ries operating across Delaware Bay. • North Carolina State is plan- ning the replacement of three pas- senger/vehicle ferries.
Key Players
Among the major publiq/quasi- public operators are Washington
State Ferries, Staten Island Ferry,
Alaska Marine Highway, Cape May-
Lewes Ferry and Golden Gate Fer- ries. Major commercial commuter ferry services are provided by com- panies such as TNT Hydrolines,
Arcorp Marine, Bridgeport/Port
Jefferson Ferry and Catalina Ex- press.
Among the operators of coastal cruise vessels are Alaska Sightseeing
Tours and Clipper Cruise Lines.
Major dinner and excursion boat op- erators are Circle Lines, Red & White
Fleet, Spirits Cruises and Horn- blower Yachts. The major dinner/ casino boat operators are Gateway
Clipper, Roberts River Rides and
Steamboat Casino River Cruises.
EXHIBIT 2
Breakdown of Ferry and Small Passenger
Vessel Fleet, by Passenger Capacity (As of December 31,1990)
No. of Passengers No. of Vessels Percent of Total 1,500+ 16 • 1,000 -1,499 26' • 500 - 999 114 2 2 100-499 839 16 50-99 729 14 20-49 2,523 47
Under 20 1,142 21
Total 5,389 100 ' Indicates less than 0.5 percent. 1 4 of the 26 vessels are subchapter T designs. 2 77 of the 114 vessels are subchapter T designs
Source: Based on an analysis of U.S. Coast Guard records.
EXHIBIT 3
Age Breakdown of Ferry and
Small Passenger Vessel Fleet (As of December 31,1990)
Year Built No. of Vessels Percent of Total1 1981 - 1990 1,9022 35 1971 - 1980 1,688 31 1961 - 1970 913 17 1951 - 1960 442 8 1941 - 1950 262 5 1931 - 1940 77 1 1921 -1930 59 1 1911 -1920 17 * 1901 -1910 10 •
Pre-1901 8 •
Total 5,378 100 * Indicates less than 0.5 percent. 1 Total excludes 11 vessels whose year of build is unknown. 2 582 of the 1902 vessels were built between 1988 and 1990.
Source: Based on an analysis of U.S. Coast Guard records.
EXHIBIT 4
Ten Year History of Ferry and
Small Passenger Vessel Construction (1981 - 1990)
No. of No. of Total
Year Subchapter H Subchapter T No. of
Built Vessels Vessels Vessels 1981 4 231 235 1982 2 174 176 1983 3 141 144 1984 2 147 149 1985 3 193 196 1986 4 215 219 1987 3 198 201 1988 2 223 225 1989 4 230 234 1990' 3 120 123 ' Construction figures for 1990 are incomplete - as some vessels built during the last quarter of the year had not yet been entered into the Coast Guard database.
Source: Based on an analysis of U.S Coast Guard records.
EXHIBIT 5
Passenger Capacity of Recently
Constructed Vessels (1986-1990)
Subchapter H Vessels Subchapter T Vessels
Passenger No. of % of No. of % of
Capacity Vessels Total Vessels Total
Over 1,000 4 25 2 * 600 -1,000 2 13 4 * 400 - 599 37 4 200 - 399 2 13 45 5 150-199 3 19 44 4 100-149 2 13 84 9 50-99 3 19 119 12
Under 50 651 66
Total 16 100' 986 100 * Indicates less than 0.5 percent. 1 Percentages may not add due to rounding.
Source: Based on an analysis of U.S. Coast Guard records. 70 Maritime Reporter/Engineering News
