Page 53: of Maritime Reporter Magazine (December 1992)
Read this page in Pdf, Flash or Html5 edition of December 1992 Maritime Reporter Magazine
 52
52
 54
54
U.S. BOATBUILDING REPORT
Survey Shows Shallow-Draft Construction Is Up
Power Driven Vessels, River Barge Construction Jumps In '91
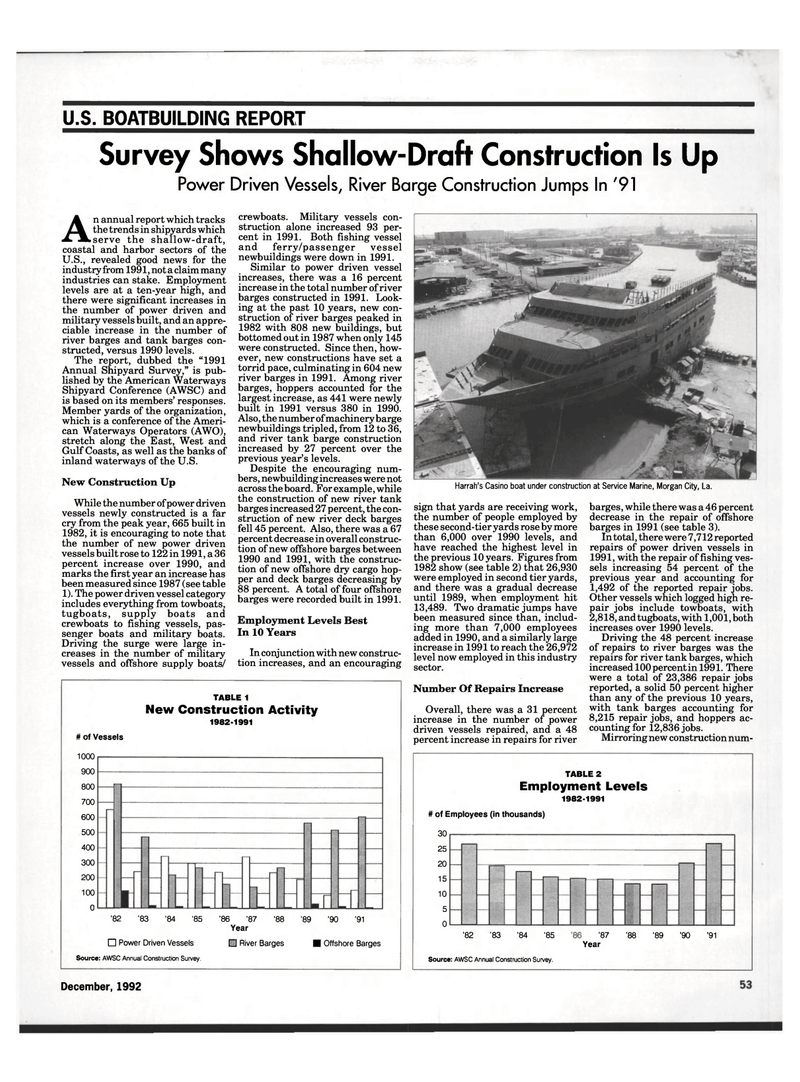
Harrah's Casino boat under construction at Service Marine, Morgan City, La.
An annual report which tracks the trends in shipyards which serve the shallow-draft, coastal and harbor sectors of the
U.S., revealed good news for the industry from 1991, not a claim many industries can stake. Employment levels are at a ten-year high, and there were significant increases in the number of power driven and military vessels built, and an appre- ciable increase in the number of river barges and tank barges con- structed, versus 1990 levels.
The report, dubbed the "1991
Annual Shipyard Survey," is pub- lished by the American Waterways
Shipyard Conference (AWSC) and is based on its members' responses.
Member yards of the organization, which is a conference of the Ameri- can Waterways Operators (AWO), stretch along the East, West and
Gulf Coasts, as well as the banks of inland waterways of the U.S.
New Construction Up
While the number of power driven vessels newly constructed is a far cry from the peak year, 665 built in 1982, it is encouraging to note that the number of new power driven vessels built rose to 122 in 1991, a 36 percent increase over 1990, and marks the first year an increase has been measured since 1987 (see table 1). The power driven vessel category includes everything from towboats, tugboats, supply boats and crewboats to fishing vessels, pas- senger boats and military boats.
Driving the surge were large in- creases in the number of military vessels and offshore supply boats/ crewboats. Military vessels con- struction alone increased 93 per- cent in 1991. Both fishing vessel and ferry/passenger vessel newbuildings were down in 1991.
Similar to power driven vessel increases, there was a 16 percent increase in the total number of river barges constructed in 1991. Look- ing at the past 10 years, new con- struction of river barges peaked in 1982 with 808 new buildings, but bottomed out in 1987 when only 145 were constructed. Since then, how- ever, new constructions have set a torrid pace, culminating in 604 new river barges in 1991. Among river barges, hoppers accounted for the largest increase, as 441 were newly built in 1991 versus 380 in 1990.
Also, the number of machinery barge newbuildings tripled, from 12 to 36, and river tank barge construction increased by 27 percent over the previous year's levels.
Despite the encouraging num- bers, newbuilding increases were not across the board. For example, while the construction of new river tank barges increased 27 percent, the con- struction of new river deck barges fell 45 percent. Also, there was a 67 percent decrease in overall construc- tion of new offshore barges between 1990 and 1991, with the construc- tion of new offshore dry cargo hop- per and deck barges decreasing by 88 percent. A total of four offshore barges were recorded built in 1991.
Employment Levels Best
In 10 Years
In conjunction with new construc- tion increases, and an encouraging sign that yards are receiving work, the number of people employed by these second-tier yards rose by more than 6,000 over 1990 levels, and have reached the highest level in the previous 10 years. Figures from 1982 show (see table 2) that 26,930 were employed in second tier yards, and there was a gradual decrease until 1989, when employment hit 13,489. Two dramatic jumps have been measured since than, includ- ing more than 7,000 employees added in 1990, and a similarly large increase in 1991 to reach the 26,972 level now employed in this industry sector.
Number Of Repairs Increase
Overall, there was a 31 percent increase in the number of power driven vessels repaired, and a 48 percent increase in repairs for river barges, while there was a 46 percent decrease in the repair of offshore barges in 1991 (see table 3).
In total, there were 7,712 reported repairs of power driven vessels in 1991, with the repair of fishing ves- sels increasing 54 percent of the previous year and accounting for 1,492 of the reported repair jobs.
Other vessels which logged high re- pair jobs include towboats, with 2,818, and tugboats, with 1,001, both increases over 1990 levels.
Driving the 48 percent increase of repairs to river barges was the repairs for river tank barges, which increased 100 percent in 1991. There were a total of 23,386 repair jobs reported, a solid 50 percent higher than any of the previous 10 years, with tank barges accounting for 8,215 repair jobs, and hoppers ac- counting for 12,836 jobs.
Mirroring new construction num-
TABLE 1
New Construction Activity 1982-1991 # of Vessels 1000 900 800 700 600 500 400 300 200 100 0 '82 '83 '84 '85 • Power Driven Vessels
Source: AWSC Annual Construction Survey. '86 '87 '88
Year • River Barges '89 '90 '91 • Offshore Barges
TABLE 2
Employment Levels 1982-1991 # of Employees (in thousands) 30 25 20 15 10 5 0 '82 '83 '84 '85
Source: AWSC Annual Construction Survey. '87 '88 '89 '90 '91
Year
December, 1992 55
