Page 56: of Maritime Reporter Magazine (December 1993)
Read this page in Pdf, Flash or Html5 edition of December 1993 Maritime Reporter Magazine
 55
55
 57
57
U.S. SECOND-TIER YARD REPORT
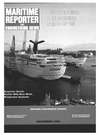
Conrad Industries Inc., Morgan City, La
AWSC Annual Report:
Offshore Barge Building And Repair Up
Newbuilding and vessel repair decreased in virtually all markets in the second-tier shipyard industry between 1991 and 1992, according to a study of the second-tier industry conducted by the American Waterways Shipyard
Conference (AWSC). The study encompasses the replies of 83 companies and looks at three main vessel categories: power driven vessels, river barges and offshore barges, as well as employ- ment information. The second-tier industry con- sists of shipyards that build and repair tugboats, towboats and barges for the domestic industry; supply boats, crewboats and other specialized vessels for the offshore service industry; and a variety of fishing vessels. Second-tier shipyards also build and repair the U.S. Navy's smaller vessels, the U.S. Coast Guard fleet and vessels operated by the Corps of Engineers and the
National Oceanic and Atmospheric Assoc.
Employment Levels Take A Dip, But Remain
High Compared To 10-Year Trends
As indicated in the study, employment levels were in a constant decline from 1983 until 1990, hitting a low in 1989 at 13,489 employed. But between 1989 and 1990, employment levels soared nearly 55 percent, rising to a total of 20,889 employees in second-tier yards in 1990.
Employment levels again rose in 1991 to 26,972, but decreased 25 percent, to 20,335, in 1992.
Newbuilding Of Power Driven Vessels Drops
Slightly; Barge Production Up
As Table 1 reveals, in the newbuilding market, 1984 was the most productive year for power driven vessels, tallying 350 power-driven vessel newbuilds.
There was a four percent decrease in the number of power driven vessels constructed be- tween 1991 and 1992, when newbuilds in this category—which includes towboats, tugboats, supply and crew boats, fishing vessels, ferries, military vessels and others-dropped from 122 to 117. Construction of towboats edged up slightly, from seven to 10, while the category "Offshore
Supply Boat, Crew Boat" took the hardest hit, dropping from 11 newbuilds in 1991 to just two in 1992.
River barge construction reached its highest level ever in the past decade, increasing 27 per- cent from 604 built in 1991 to 765 built in 1992.
By type, the construction of river hoppers in- creased 39 percent and construction of river deck barges rose 77 percent, the survey reports.
Newbuilds in the offshore barge category re- bounded nicely from a decade-low of four manu- factured in 1991. In 1992, offshore barge produc- tion quadrupled to 16 newbuilds. By barge type, offshore tank barge construction increased 600 percent in 1992.
Repair Work Slides
Table 2 shows that repairs on power driven vessels rose consecutively from 1983 until 1988, reaching its pinnacle of 8,613 vessels recorded repaired in 1988. Reported repairs then de- clined for the next two years, then picked up again in 1991. The number of power driven vessels repaired in 1992 decreased 24 percent to 5,827.
Repairs of river barges were highest in 1991 but decreased 26 percent in 1992 to 17,398; repairs for river hoppers decreased 22 percent and repairs for river tank barges decreased 30 percent.
Repair of offshore barges peaked in 1990, numbering 752. Repair in this sector decreased from that number in 1991 to 407, only to in- crease 25 percent in 1992 to 508.
For a copy of the full report, contact The
American Waterways Shipyard Conference, 1600 Wilson Blvd., Ste. 1000, Arlington, Va. 22209, tel: (703) 841-9300.
TABLE 2
Repair Activity (1983-1992)
Year Power Driven River Offshore
Vessels Barges Barges 198 3 5,422 8,958 531 198 4 6,085 9,631 484 198 5 :.. 6,606 7,079 531 198 6 7,341 9,399 317 198 7 7,886 11,345 333 198 8 8,613 11,071 397 198 9 5,974 13,810 356 199 0 5,891 15,825 752 199 1 7,712 23,386 407 199 2 5,827 17,398 508
Source: AWSC Annual Shipyard Survey
TABLE 1
New Construction Activity (1983 to 1992)
Year Power Driven River Offshore
Vessels Barges Barges 1983... 240 483 17 1984... 350 221 10 1985... 300 277 8 1986... 239 166 5 1987... 348 145 9 1988... 237 278 6 1989... 196 571 29 1990... 90 521 12 1991 ... 122 604 4 1992... 117 ...... 765 16
Source: AWSC Annual Shipyard Survey 58 Maritime Reporter/Engineering News
