Page 85: of Maritime Reporter Magazine (October 1994)
Read this page in Pdf, Flash or Html5 edition of October 1994 Maritime Reporter Magazine
 84
84
 86
86
AWSC 1993
Annual
Report
Second-Tier Shipyards Activity Revealed segment and has released its 1993 survey.
The purpose of the survey is to provide an accurate statistical industry profile for, among other things, the consideration of legislation af- fecting the industry.
AWSC is the only association which collects and reports this kind of information for second- tier shipyards.
Employment
One indicator of a shipbuilding segment's health is its employment levels. The AWSC report indicates the continuance of a downward trend in employment for 1993 (See chart, pg. 73).
However, the highest employment level for the years examined (1984-1993) was 1991, which boasted a level of 26,972, significantly higher than the years both preceding and succeeding it — so the drop may possibly be interpreted as more of a return to a certain level of employment than a rapid plunge.
The report's section on Employment Informa- tion and Trends contains information not only on activities related to shipyard employment, but also turnover rate for 1993, and cost of state workers' compensation per employee for 1993.
New Construction Activity
In 1993, according to the report, 97 percent of all respondents gave information on new con- struction and repair activities, and of those, 33 percent said they had worked on new construc- tion in 1992.
New construction activity examined by the
TABLE 1
New Construction Activity
Year Power Driven River Barges Offshore Barges
Vessels 1984 350 221 10 1985 300 277 8 1986 239 166 5 1987 348 145 9 1988 237 278 6 1989 196 571 29 1990 90 521 12 1991 122 604 4 1992 117 765 16 1993 147 675 130
TABLE 2
BREAKDOWN OF NEW CONSTRUCTION ACTIVITY 1984 - 1993 1984 1985 1986 1987 1988 1989 1990 1991 1992 1993
POWER DRIVEN VESSELS
Towboats 12 9 1 2 3 4 4 7 10 11
Tugboats 10 8 7 18 11 8 6 6 3 10
Offshore supply boats, crewboats 21 8 1 23 0 18 2 11 2 2
Fishing vessels 24 20 21 30 23 15 9 4 15 6
Ferries, passenger vessels 24 22 20 17 24 27 17 14 12 6
Military vessels 120 120 90 122 119 39 27 52 46 45
Other 139 113 99 136 57 85 25 28 29 67
RIVER BARGES
Hoppers 155 203 120 45 217 484 380 441 612 594
LASH and
SEABEE barges 8 8 4 4 9 18 64 81 92 47
Tank barges 0 0 4 0 0 0 0 0 0 0
Deck barges 40 58 31 45 40 49 55 30 53 21
Machinery & other work barges 6 3 0 0 2 12 12 36 7 6
Other 12 5 7 51 10 8 10 16 1 7
OFFSHORE BARGES
Dry cargo hopper and deck barges 2 1 0 3 3 7 8 1 5 12
Tank barges 1 2 5 6 2 10 3 1 7 14
Machinery & other work barges 2 0 0 0 1 1 0 1 1 2
Other 5 5 0 0 0 11 1 1 3 102
TOTAL NUMBER OF VESSELS BUILT BY YEAR 1984 1985 1986 1987 1988 1989 1990 1991 1992 1993
POWER DRIVEN
VESSELS 350 300 239 348 237 196 90 122 117 147
RIVER BARGES 221 277 166 145 278 571 521 604 765 675
OFFSHORE
BARGES 10 8 5 9 6 29 12 4 16 130
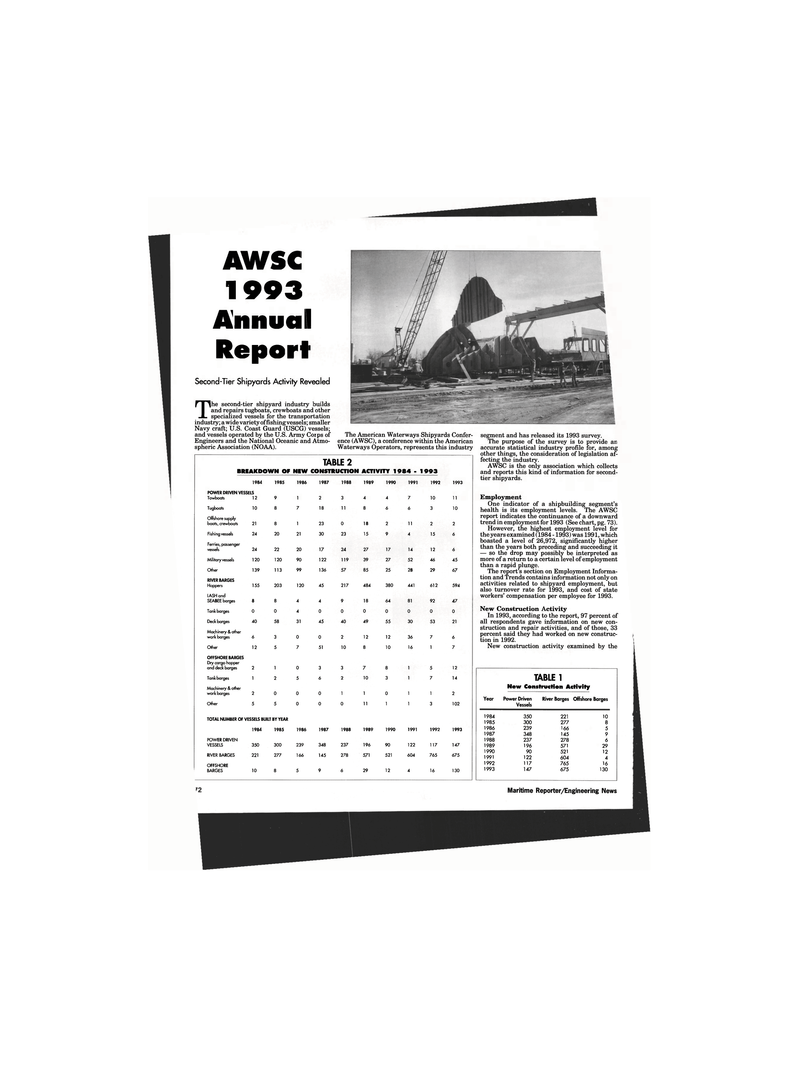
The second-tier shipyard industry builds and repairs tugboats, crewboats and other specialized vessels for the transport ation industry; a wide variety of fishing vessels; smaller
Navy craft; U.S. Coast Guard (USCG) vessels; and vessels operated by the U.S. Army Corps of
Engineers and the National Oceanic and Atmo- spheric Association (NOAA).
The American Waterways Shipyards Confer- ence (AWSC), a conference within the American
Waterways Operators, represents this industry 87 Maritime Reporter/Engineering News
