Page 130: of Maritime Reporter Magazine (June 1999)
Read this page in Pdf, Flash or Html5 edition of June 1999 Maritime Reporter Magazine
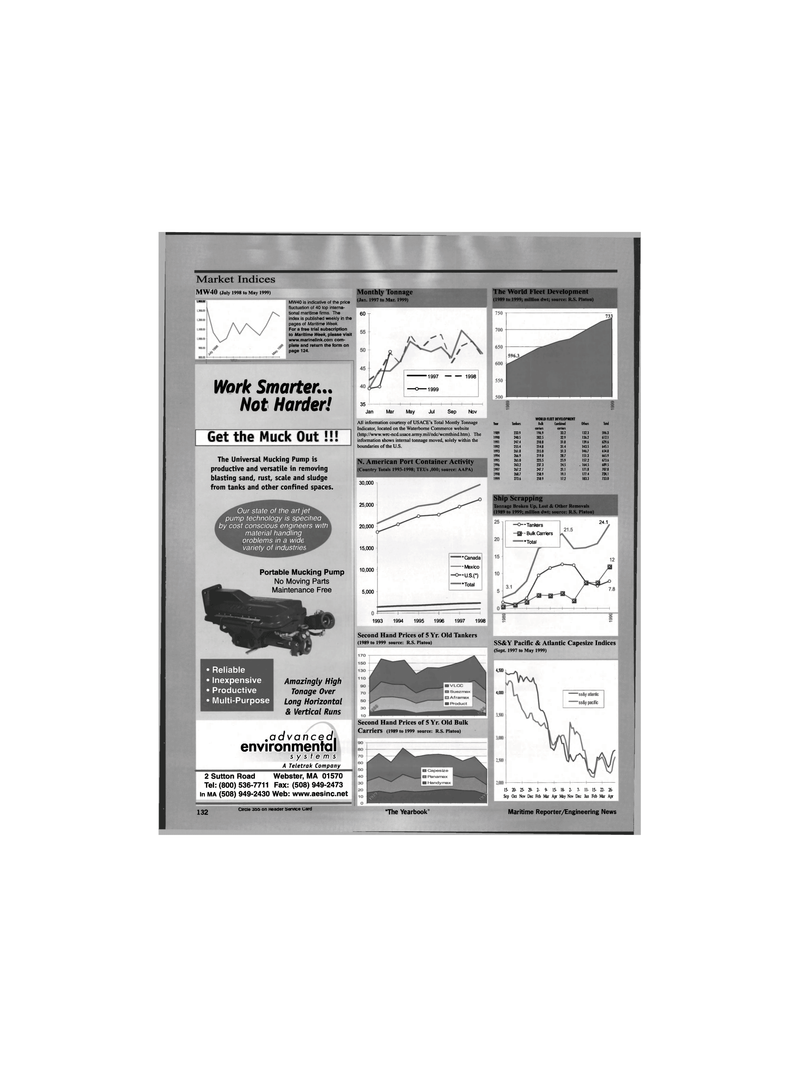
Market Indices
MW40 (July 1998 to May 1999) 1,4(0.00 MW40 is indicative of the price fluctuation of 40 top interna- tional maritime firms. The index is published weekly in the pages of Maritime Week.
For a free trial subscription to Maritime Week, please visit www.marjnellnk.com com- plete and return the form on page 124.
Monthly Tonnage (Jan. 1997 to Mar. 1999)
Work Smarten..
Net Harder!
Get the Muck Out !!!
The Universal Mucking Pump is productive and versatile in removing blasting sand, rust, scale and sludge from tanks and other confined spaces.
Our state of the art jet pump technology is specified by cost conscious engineers with material handling problems in a wide variety of industries
Portable Mucking Pump
No Moving Parts
Maintenance Free • Reliable • Inexpensive • Productive • Multi-Purpose
Amazingly High
Tonage Over
Long Horizontal & Vertical Runs .advanced, environmental systems
A Teletrak Company 2 Sutton Road Webster, MA 01570
Tel: (800) 536-7711 Fax: (508) 949-2473 in MA (508) 949-2430 Web: www.aesinc.net 132 Circle 355 on Reader Service Card 60 r 1997 - 1998 —O—1999 35 —
Jan Mar May Jul Sep Nov
All information courtesy of USACE's Total Montly Tonnage
Indicator, located on the Waterborne Commerce website (http://www.wrc-ncd.usace.army.mil/ndc/wcmthind.htm). The information shows internal tonnage moved, solely within the boundaries of the U.S.
N. American Port Container Activity (Country Totals 1993-1998; TEUs ,000; source: AAPA) 30,000 25,000 20,000 15,000 10,000 5,000 "Canada • Mexico -U.S.0 •Total -+- -+- 1993
Second Hand Prices of 5 Yr. Old Tankers (1989 to 1999 source: R.S. Platou)
Second Hand Prices of 5 Yr. Old Bulk
Carriers (1989 to 1999 source: R.S. Platou)
The World Fleet Development (1989 to 1999; million dwt; source: R.S. Platou) 1994 1995 1996 1997 1998
WORLD FLEET DEVELOPMENT
Yen Tankers Bulk Combined Others Total carriers carriers 1989 233.9 196.9 33.2 132.3 596.3 1990 240.5 202.5 32.9 136.2 (12.1 1991 247.4 210.8 31.8 139.6 629.6 1992 255.4 214.8 31.4 143.5 645.1 1993 261.8 215.0 31.3 146.7 654.8 1994 266.9 219.0 28.7 151.3 665.9 1995 265.0 225.5 25.9 157.2 673.6 1996 263.2 237.3 24.5 . 164.5 689.5 1997 267.2 247.7 21.1 171.8 707.8 1998 268.7 258.9 19.1 177.4 724.1 1999 273.6 258.9 17.2 183.3 733.0
Ship Scrapping
Tonnage Broken Up, Lost & Other Removals (1989 to 1999; million dwt; source: R.S. Platou) •Tankers - Bulk Carriers •Total 24.1
SS&Y Pacific & Atlantic Capesize Indices (Sept. 1997 to May 1999) 4,500 4,000 15- 20- 25- 29- 2- 9- 15- 18- 2- 7- 11- 15- 22- 26-
Sep Oct Nov Dec Feb Mar Apr May Nov Dec Jan Feb Mar Apr "The Yearbook Maritime Reporter/Engineering News

 129
129

 131
131
