Page 14: of Maritime Reporter Magazine (February 2000)
Read this page in Pdf, Flash or Html5 edition of February 2000 Maritime Reporter Magazine
Statistics & Analysis
E&P Spending 2000: Boom or Bust?
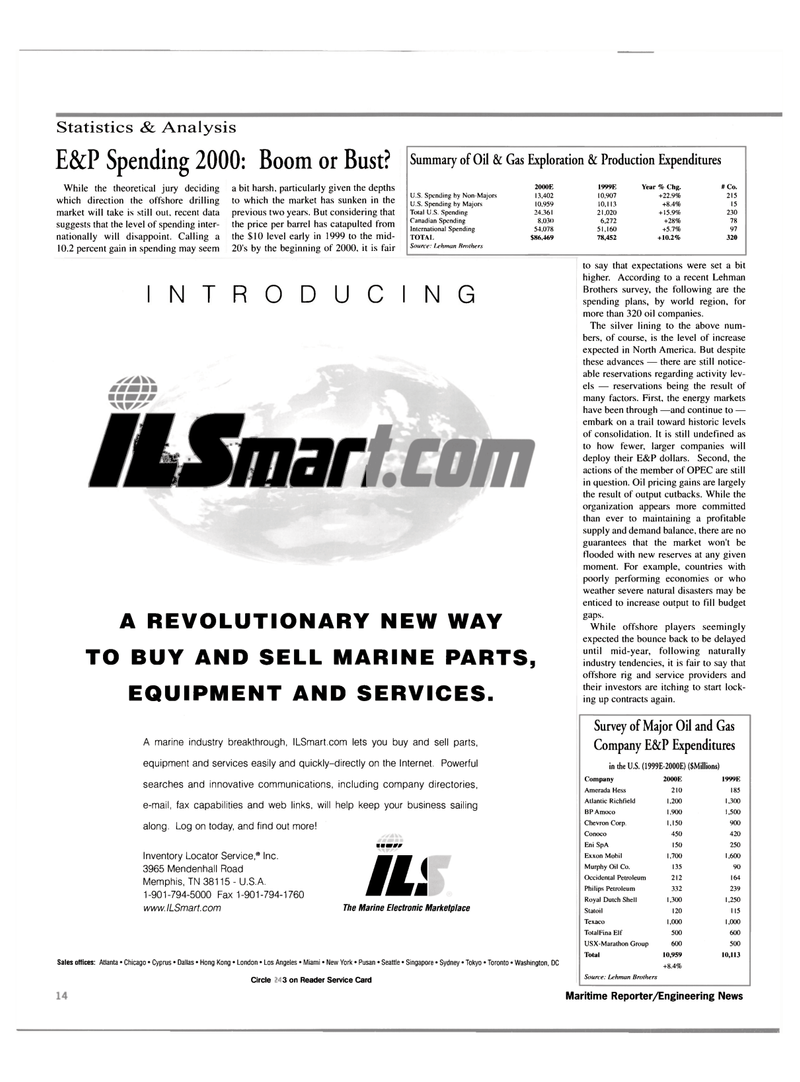
While the theoretical jury deciding which direction the offshore drilling market will take is still out, recent data suggests that the level of spending inter- nationally will disappoint. Calling a 10.2 percent gain in spending may seem a bit harsh, particularly given the depths to which the market has sunken in the previous two years. But considering that the price per barrel has catapulted from the $10 level early in 1999 to the mid- 20's by the beginning of 2000, it is fair
Summary of Oil & Gas Exploration & Production Expenditures 2000E 1999E Year % Chg. # Co.
U.S. Spending by Non-Majors 13.402 10,907 +22.9% 215
U.S. Spending by Majors 10.959 10,113 +8.4% 15
Total U.S. Spending 24,361 21,020 + 15.9% 230
Canadian Spending 8.030 6,272 +28% 78
International Spending 54.078 51,160 +5.7% 97
TOTAL $86,469 78,452 +10.2% 320
Source: Lehman Brothers
INTRODUCING
ILSmar
A REVOLUTIONARY NEW WAY
TO BUY AND SELL MARINE PARTS,
EQUIPMENT AND SERVICES.
A marine industry breakthrough, ILSmart.com lets you buy and sell parts, equipment and services easily and quickly-directly on the Internet. Powerful searches and innovative communications, including company directories, e-mail, fax capabilities and web links, will help keep your business sailing along. Log on today, and find out more!
Inventory Locator Service,® Inc. 3965 Mendenhall Road
Memphis, TN 38115 - U.S.A. 1-901-794-5000 Fax 1-901-794-1760 www. ILSmart. com ummmr US
The Marine Electronic Marketplace
Sales offices: Atlanta • Chicago • Cyprus • Dallas • Hong Kong • London • Los Angeles • Miami • New York • Pusan • Seattle • Singapore • Sydney • Tokyo • Toronto • Washington, DC
Circle 317 on Reader Service Card to say that expectations were set a bit higher. According to a recent Lehman
Brothers survey, the following are the spending plans, by world region, for more than 320 oil companies.
The silver lining to the above num- bers, of course, is the level of increase expected in North America. But despite these advances — there are still notice- able reservations regarding activity lev- els — reservations being the result of many factors. First, the energy markets have been through —and continue to — embark on a trail toward historic levels of consolidation. It is still undefined as to how fewer, larger companies will deploy their E&P dollars. Second, the actions of the member of OPEC are still in question. Oil pricing gains are largely the result of output cutbacks. While the organization appears more committed than ever to maintaining a profitable supply and demand balance, there are no guarantees that the market won't be
Hooded with new reserves at any given moment. For example, countries with poorly performing economies or who weather severe natural disasters may be enticed to increase output to fill budget gaps.
While offshore players seemingly expected the bounce back to be delayed until mid-year, following naturally industry tendencies, it is fair to say that offshore rig and service providers and their investors are itching to start lock- ing up contracts again.
Survey of Major Oil and Gas
Company E&P Expenditures in the U.S. (1999E-2000E) (SMillions)
Company 2000E 1999E
Amerada Hess 210 185
Atlantic Richfield 1,200 1,300
BP Amoco 1,900 1,500
Chevron Corp. 1,150 900
Conoco 450 420
Eni SpA 150 250
Exxon Mobil 1,700 1,600
Murphy Oil Co. 135 90
Occidental Petroleum 212 164
Philips Petroleum 332 239
Royal Dutch Shell 1,300 1.250
Statoil 120 115
Texaco 1,000 1,000
TotalFina Elf 500 600
USX-Marathon Group 600 500
Total 10,959 10,113 +8.4%
Source: Lehman Brothers 16 Maritime Reporter/Engineering News

 13
13

 15
15
