Page 34: of Maritime Reporter Magazine (September 2013)
Workboat Annual
Read this page in Pdf, Flash or Html5 edition of September 2013 Maritime Reporter Magazine
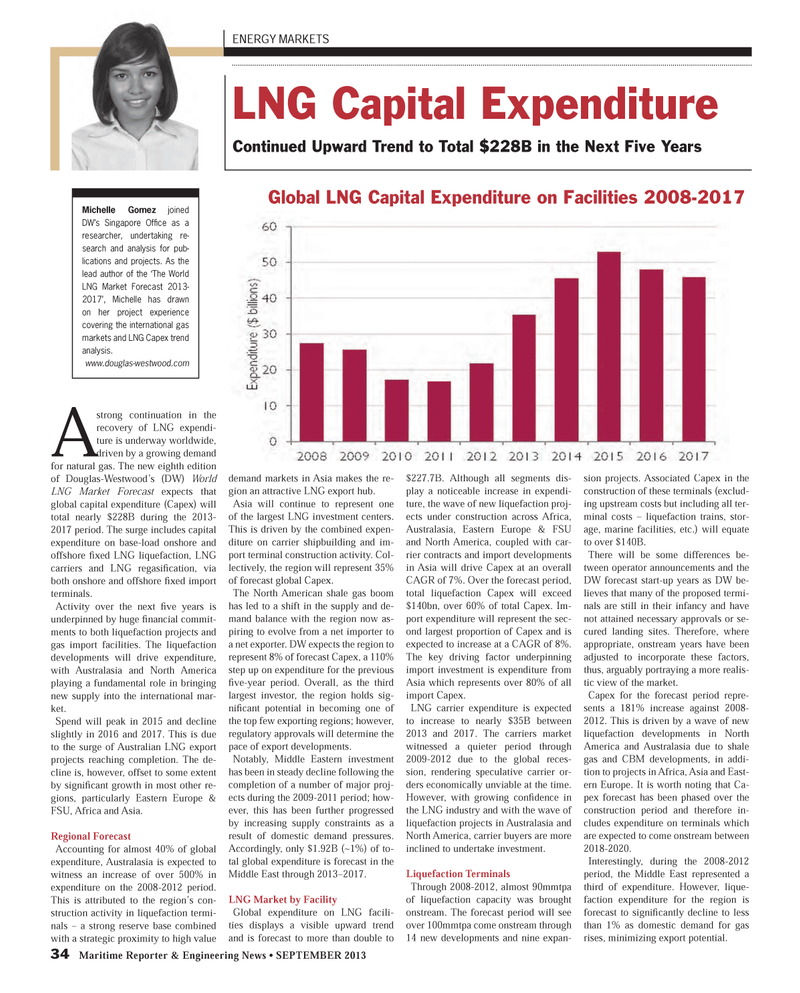
34 Maritime Reporter & Engineering News ? SEPTEMBER 2013 A strong continuation in the recovery of LNG expendi-ture is underway worldwide, driven by a growing demand for natural gas. The new eighth edition of Douglas-Westwood?s (DW) World LNG Market Forecast expects that global capital expenditure (Capex) will total nearly $228B during the 2013-2017 period. The surge includes capital expenditure on base-load onshore and offshore Þ xed LNG liquefaction, LNG carriers and LNG regasiÞ cation, via both onshore and offshore Þ xed import terminals.Activity over the next Þ ve years is underpinned by huge Þ nancial commit- ments to both liquefaction projects and gas import facilities. The liquefaction developments will drive expenditure, with Australasia and North America playing a fundamental role in bringing new supply into the international mar- ket.Spend will peak in 2015 and decline slightly in 2016 and 2017. This is due to the surge of Australian LNG export projects reaching completion. The de- cline is, however, offset to some extent by signiÞ cant growth in most other re- gions, particularly Eastern Europe & FSU, Africa and Asia. Regional Forecast Accounting for almost 40% of global expenditure, Australasia is expected to witness an increase of over 500% in expenditure on the 2008-2012 period. This is attributed to the region?s con- struction activity in liquefaction termi-nals ? a strong reserve base combined with a strategic proximity to high value demand markets in Asia makes the re- gion an attractive LNG export hub. Asia will continue to represent one of the largest LNG investment centers. This is driven by the combined expen-diture on carrier shipbuilding and im-port terminal construction activity. Col- lectively, the region will represent 35% of forecast global Capex.The North American shale gas boom has led to a shift in the supply and de-mand balance with the region now as-piring to evolve from a net importer to a net exporter. DW expects the region to represent 8% of forecast Capex, a 110% step up on expenditure for the previous Þ ve-year period. Overall, as the third largest investor, the region holds sig- niÞ cant potential in becoming one of the top few exporting regions; however, regulatory approvals will determine the pace of export developments.Notably, Middle Eastern investment has been in steady decline following the completion of a number of major proj-ects during the 2009-2011 period; how- ever, this has been further progressed by increasing supply constraints as a result of domestic demand pressures. Accordingly, only $1.92B (~1%) of to- tal global expenditure is forecast in the Middle East through 2013?2017. LNG Market by FacilityGlobal expenditure on LNG facili-ties displays a visible upward trend and is forecast to more than double to $227.7B. Although all segments dis- play a noticeable increase in expendi-ture, the wave of new liquefaction proj-ects under construction across Africa, Australasia, Eastern Europe & FSU and North America, coupled with car- rier contracts and import developments in Asia will drive Capex at an overall CAGR of 7%. Over the forecast period, total liquefaction Capex will exceed $140bn, over 60% of total Capex. Im-port expenditure will represent the sec-ond largest proportion of Capex and is expected to increase at a CAGR of 8%. The key driving factor underpinning import investment is expenditure from Asia which represents over 80% of all import Capex. LNG carrier expenditure is expected to increase to nearly $35B between 2013 and 2017. The carriers market witnessed a quieter period through 2009-2012 due to the global reces-sion, rendering speculative carrier or- ders economically unviable at the time. However, with growing con Þ dence in the LNG industry and with the wave of liquefaction projects in Australasia and North America, carrier buyers are more inclined to undertake investment.Liquefaction Terminals Through 2008-2012, almost 90mmtpa of liquefaction capacity was brought onstream. The forecast period will see over 100mmtpa come onstream through 14 new developments and nine expan-sion projects. Associated Capex in the construction of these terminals (exclud-ing upstream costs but including all ter- minal costs ? liquefaction trains, stor- age, marine facilities, etc.) will equate to over $140B.There will be some differences be- tween operator announcements and the DW forecast start-up years as DW be- lieves that many of the proposed termi-nals are still in their infancy and have not attained necessary approvals or se-cured landing sites. Therefore, where appropriate, onstream years have been adjusted to incorporate these factors, thus, arguably portraying a more realis- tic view of the market.Capex for the forecast period repre-sents a 181% increase against 2008-2012. This is driven by a wave of new liquefaction developments in North America and Australasia due to shale gas and CBM developments, in addi-tion to projects in Africa, Asia and East- ern Europe. It is worth noting that Ca-pex forecast has been phased over the construction period and therefore in-cludes expenditure on terminals which are expected to come onstream between 2018-2020.Interestingly, during the 2008-2012 period, the Middle East represented a third of expenditure. However, lique- faction expenditure for the region is forecast to signiÞ cantly decline to less than 1% as domestic demand for gas rises, minimizing export potential.ENERGY MARKETS LNG Capital Expenditure Continued Upward Trend to Total $228B in the Next Five Years Michelle Gomez joined DW?s Singapore Of ce as a researcher, undertaking re- search and analysis for pub- lications and projects. As the lead author of the ?The World LNG Market Forecast 2013- 2017?, Michelle has drawn on her project experience covering the international gas markets and LNG Capex trend analysis. www.douglas-westwood.com Global LNG Capital Expenditure on Facilities 2008-2017 MR #9 (34-41).indd 34MR #9 (34-41).indd 349/4/2013 4:38:26 PM9/4/2013 4:38:26 PM

 33
33

 35
35
