Page 73: of Maritime Reporter Magazine (September 2013)
Workboat Annual
Read this page in Pdf, Flash or Html5 edition of September 2013 Maritime Reporter Magazine
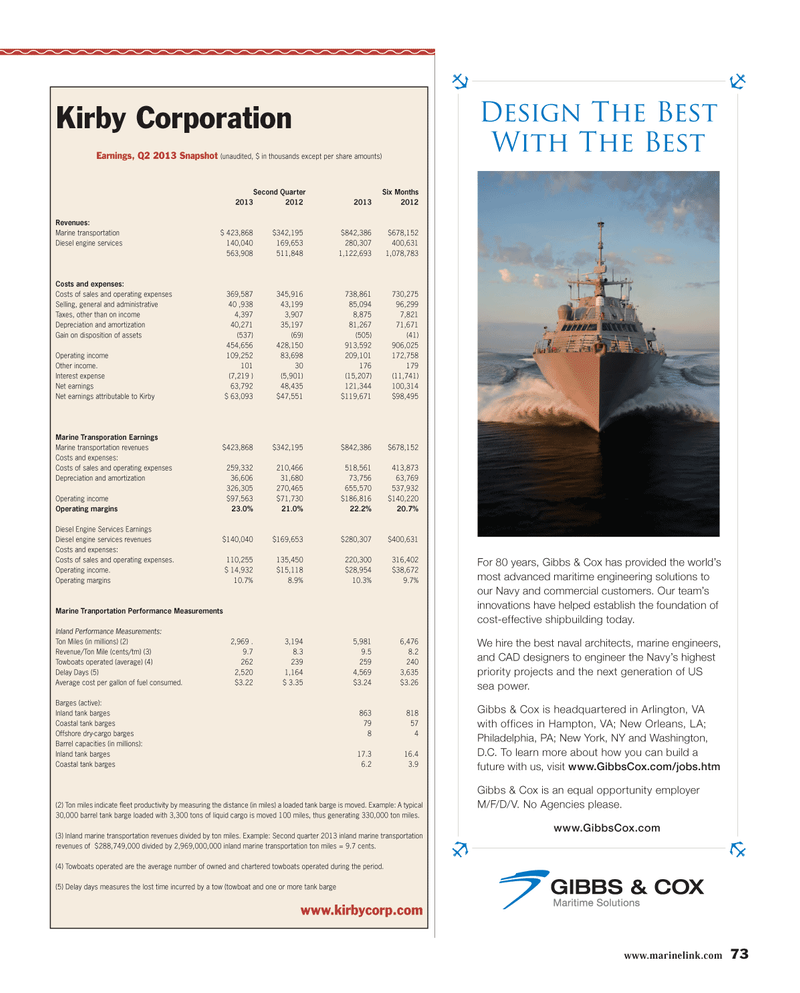
www.marinelink.com 73For 80 years, Gibbs & Cox has provided the worlds most advanced maritime engineering solutions to our Navy and commercial customers. Our teams innovations have helped establish the foundation of cost-effective shipbuilding today. We hire the best naval architects, marine engineers, and CAD designers to engineer the Navys highest priority projects and the next generation of US sea power. Gibbs & Cox is headquartered in Arlington, VA with offices in Hampton, VA; New Orleans, LA; Philadelphia, PA; New York, NY and Washington, D.C. To learn more about how you can build a future with us, visit www.GibbsCox.com/jobs.htm Gibbs & Cox is an equal opportunity employer M/F/D/V. No Agencies please. www.GibbsCox.com Design The Best With The Best Kirby CorporationEarnings, Q2 2013 Snapshot (unaudited, $ in thousands except per share amounts) Second Quarter Six Months 2013 2012 2013 2012 Revenues:Marine transportation $ 423,868 $342,195 $842,386 $678,152 Diesel engine services 140,040 169,653 280,307 400,631 563,908 511,848 1,122,693 1,078,783 Costs and expenses:Costs of sales and operating expenses 369,587 345,916 738,861 730,275 Selling, general and administrative 40 ,938 43,199 85,094 96,299 Taxes, other than on income 4,397 3,907 8,875 7,821 Depreciation and amortization 40,271 35,197 81,267 71,671 Gain on disposition of assets (537) (69) (505) (41) 454,656 428,150 913,592 906,025 Operating income 109,252 83,698 209,101 172,758 Other income. 101 30 176 179 Interest expense (7,219 ) (5,901) (15,207) (11,741) Net earnings 63,792 48,435 121,344 100,314 Net earnings attributable to Kirby $ 63,093 $47,551 $119,671 $98,495 Marine Transporation Earnings Marine transportation revenues $423,868 $342,195 $842,386 $678,152 Costs and expenses:Costs of sales and operating expenses 259,332 210,466 518,561 413,873 Depreciation and amortization 36,606 31,680 73,756 63,769 326,305 270,465 655,570 537,932 Operating income $97,563 $71,730 $186,816 $140,220 Operating margins 23.0% 21.0% 22.2% 20.7% Diesel Engine Services EarningsDiesel engine services revenues $140,040 $169,653 $280,307 $400,631 Costs and expenses:Costs of sales and operating expenses. 110,255 135,450 220,300 316,402 Operating income. $ 14,932 $15,118 $28,954 $38,672 Operating margins 10.7% 8.9% 10.3% 9.7% Marine Tranportation Performance Measurements Inland Performance Measurements: Ton Miles (in millions) (2) 2,969 . 3,194 5,981 6,476 Revenue/Ton Mile (cents/tm) (3) 9.7 8.3 9.5 8.2 Towboats operated (average) (4) 262 239 259 240 Delay Days (5) 2,520 1,164 4,569 3,635 Average cost per gallon of fuel consumed. $3.22 $ 3.35 $3.24 $3.26 Barges (active): Inland tank barges 863 818 Coastal tank barges 79 57 Offshore dry-cargo barges 8 4Barrel capacities (in millions): Inland tank barges 17.3 16.4 Coastal tank barges 6.2 3.9 (2) Ton miles indicate ß eet productivity by measuring the distance (in miles) a loaded tank barge is moved. Example: A typical 30,000 barrel tank barge loaded with 3,300 tons of liquid cargo is moved 100 miles, thus generating 330,000 ton miles. (3) Inland marine transportation revenues divided by ton miles. Example: Second quarter 2013 inland marine transportation revenues of $288,749,000 divided by 2,969,000,000 inland marine transportation ton miles = 9.7 cents. (4) Towboats operated are the average number of owned and chartered towboats operated during the period. (5) Delay days measures the lost time incurred by a tow (towboat and one or more tank barge www.kirbycorp.com MR #9 (66-73).indd 73MR #9 (66-73).indd 738/30/2013 10:22:03 AM8/30/2013 10:22:03 AM

 72
72

 74
74
