
Page 57: of Maritime Reporter Magazine (June 2014)
Annual World Yearbook
Read this page in Pdf, Flash or Html5 edition of June 2014 Maritime Reporter Magazine
 56
56
 58
58
www.marinelink.com 57
The November 2011 Fact Card pro- duced by the U.S. Army Corps of Engi- neers’ Navigation Data Center is a reveal- ing look at the composition of America’s
Inland waterways. The fact card provides an overview of information about U.S. ports and waterways for the latest com- plete statistical year. Domestic data is col- lected by NDC.
Vessel Facts
There were 1,178 domestic vessels constructed in 2010, an increase of 25% from 939 that were constructed in 2009.
This metric is re?ected positively in the fact that the number of double hull tank barges has increased signi? cantly from 2,530 in 1997 to 3,359 in 2010, a 32.8% increase.
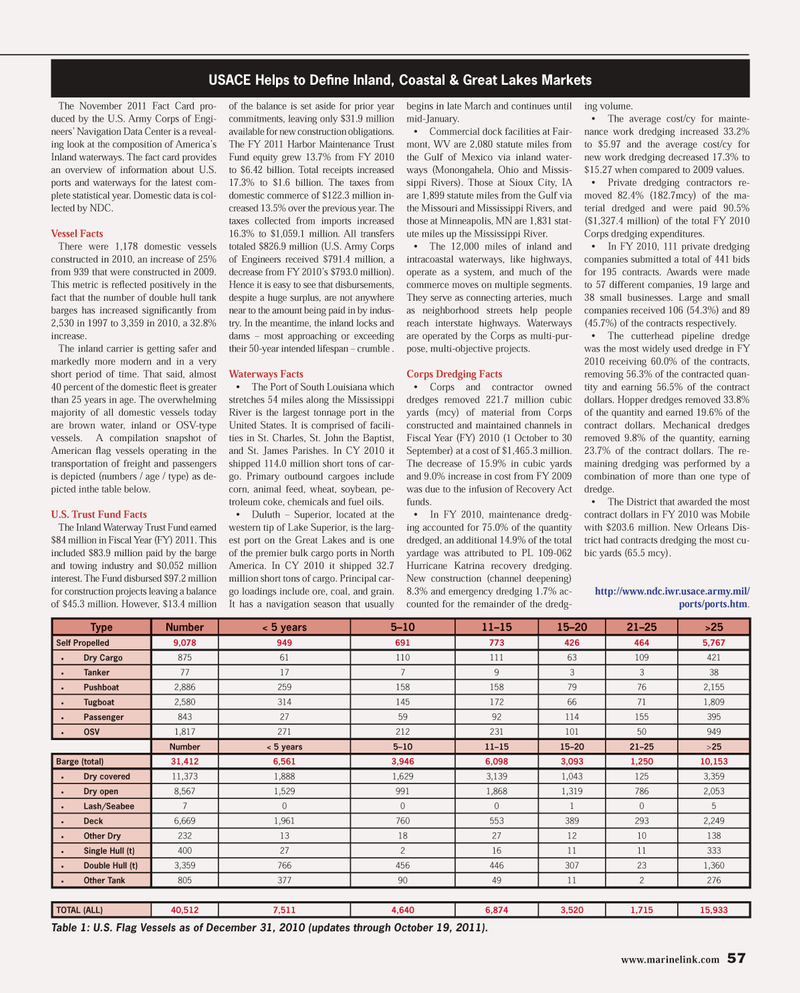
The inland carrier is getting safer and markedly more modern and in a very short period of time. That said, almost 40 percent of the domestic ? eet is greater than 25 years in age. The overwhelming majority of all domestic vessels today are brown water, inland or OSV-type vessels. A compilation snapshot of
American ? ag vessels operating in the transportation of freight and passengers is depicted (numbers / age / type) as de- picted inthe table below.
U.S. Trust Fund Facts
The Inland Waterway Trust Fund earned $84 million in Fiscal Year (FY) 2011. This included $83.9 million paid by the barge and towing industry and $0.052 million interest. The Fund disbursed $97.2 million for construction projects leaving a balance of $45.3 million. However, $13.4 million of the balance is set aside for prior year commitments, leaving only $31.9 million available for new construction obligations.
The FY 2011 Harbor Maintenance Trust
Fund equity grew 13.7% from FY 2010 to $6.42 billion. Total receipts increased 17.3% to $1.6 billion. The taxes from domestic commerce of $122.3 million in- creased 13.5% over the previous year. The taxes collected from imports increased 16.3% to $1,059.1 million. All transfers totaled $826.9 million (U.S. Army Corps of Engineers received $791.4 million, a decrease from FY 2010’s $793.0 million).
Hence it is easy to see that disbursements, despite a huge surplus, are not anywhere near to the amount being paid in by indus- try. In the meantime, the inland locks and dams – most approaching or exceeding their 50-year intended lifespan – crumble .
Waterways Facts • The Port of South Louisiana which stretches 54 miles along the Mississippi
River is the largest tonnage port in the
United States. It is comprised of facili- ties in St. Charles, St. John the Baptist, and St. James Parishes. In CY 2010 it shipped 114.0 million short tons of car- go. Primary outbound cargoes include corn, animal feed, wheat, soybean, pe- troleum coke, chemicals and fuel oils. • Duluth – Superior, located at the western tip of Lake Superior, is the larg- est port on the Great Lakes and is one of the premier bulk cargo ports in North
America. In CY 2010 it shipped 32.7 million short tons of cargo. Principal car- go loadings include ore, coal, and grain.
It has a navigation season that usually begins in late March and continues until mid-January. • Commercial dock facilities at Fair- mont, WV are 2,080 statute miles from the Gulf of Mexico via inland water- ways (Monongahela, Ohio and Missis- sippi Rivers). Those at Sioux City, IA are 1,899 statute miles from the Gulf via the Missouri and Mississippi Rivers, and those at Minneapolis, MN are 1,831 stat- ute miles up the Mississippi River. • The 12,000 miles of inland and intracoastal waterways, like highways, operate as a system, and much of the commerce moves on multiple segments.
They serve as connecting arteries, much as neighborhood streets help people reach interstate highways. Waterways are operated by the Corps as multi-pur- pose, multi-objective projects.
Corps Dredging Facts • Corps and contractor owned dredges removed 221.7 million cubic yards (mcy) of material from Corps constructed and maintained channels in
Fiscal Year (FY) 2010 (1 October to 30
September) at a cost of $1,465.3 million.
The decrease of 15.9% in cubic yards and 9.0% increase in cost from FY 2009 was due to the infusion of Recovery Act funds. • In FY 2010, maintenance dredg- ing accounted for 75.0% of the quantity dredged, an additional 14.9% of the total yardage was attributed to PL 109-062
Hurricane Katrina recovery dredging.
New construction (channel deepening) 8.3% and emergency dredging 1.7% ac- counted for the remainder of the dredg- ing volume. • The average cost/cy for mainte- nance work dredging increased 33.2% to $5.97 and the average cost/cy for new work dredging decreased 17.3% to $15.27 when compared to 2009 values. • Private dredging contractors re- moved 82.4% (182.7mcy) of the ma- terial dredged and were paid 90.5% ($1,327.4 million) of the total FY 2010
Corps dredging expenditures. • In FY 2010, 111 private dredging companies submitted a total of 441 bids for 195 contracts. Awards were made to 57 different companies, 19 large and 38 small businesses. Large and small companies received 106 (54.3%) and 89 (45.7%) of the contracts respectively. • The cutterhead pipeline dredge was the most widely used dredge in FY 2010 receiving 60.0% of the contracts, removing 56.3% of the contracted quan- tity and earning 56.5% of the contract dollars. Hopper dredges removed 33.8% of the quantity and earned 19.6% of the contract dollars. Mechanical dredges removed 9.8% of the quantity, earning 23.7% of the contract dollars. The re- maining dredging was performed by a combination of more than one type of dredge. • The District that awarded the most contract dollars in FY 2010 was Mobile with $203.6 million. New Orleans Dis- trict had contracts dredging the most cu- bic yards (65.5 mcy). http://www.ndc.iwr.usace.army.mil/ ports/ports.htm.
Type Number < 5 years 5–10 11–15 15–20 21–25 >25
Self Propelled 9,078 949 691 773 426 464 5,767 • Dry Cargo 875 61 110 111 63 109 421 • Tanker 77 17 7 9 3 3 38 • Pushboat 2,886 259 158 158 79 76 2,155 • Tugboat 2,580 314 145 172 66 71 1,809 • Passenger 843 27 59 92 114 155 395 • OSV 1,817 271 212 231 101 50 949
Number < 5 years 5–10 11–15 15–20 21–25 >25
Barge (total) 31,412 6,561 3,946 6,098 3,093 1,250 10,153 • Dry covered 11,373 1,888 1,629 3,139 1,043 125 3,359 • Dry open 8,567 1,529 991 1,868 1,319 786 2,053 • Lash/Seabee 7 0 0 0 10 5 • Deck 6,669 1,961 760 553 389 293 2,249 • Other Dry 232 13 18 27 12 10 138 • Single Hull (t) 400 27 2 16 11 11 333 • Double Hull (t) 3,359 766 456 446 307 23 1,360 • Other Tank 805 377 90 49 11 2 276
TOTAL (ALL) 40,512 7,511 4,640 6,874 3,520 1,715 15,933
Table 1: U.S. Flag Vessels as of December 31, 2010 (updates through October 19, 2011).
USACE Helps to Defi ne Inland, Coastal & Great Lakes Markets
MR #6 (50-57).indd 57 6/9/2014 11:27:27 AM
