
Page 60: of Maritime Reporter Magazine (June 2014)
Annual World Yearbook
Read this page in Pdf, Flash or Html5 edition of June 2014 Maritime Reporter Magazine
 59
59
 61
61
THE 2014 YEARBOOK: STATISTICS
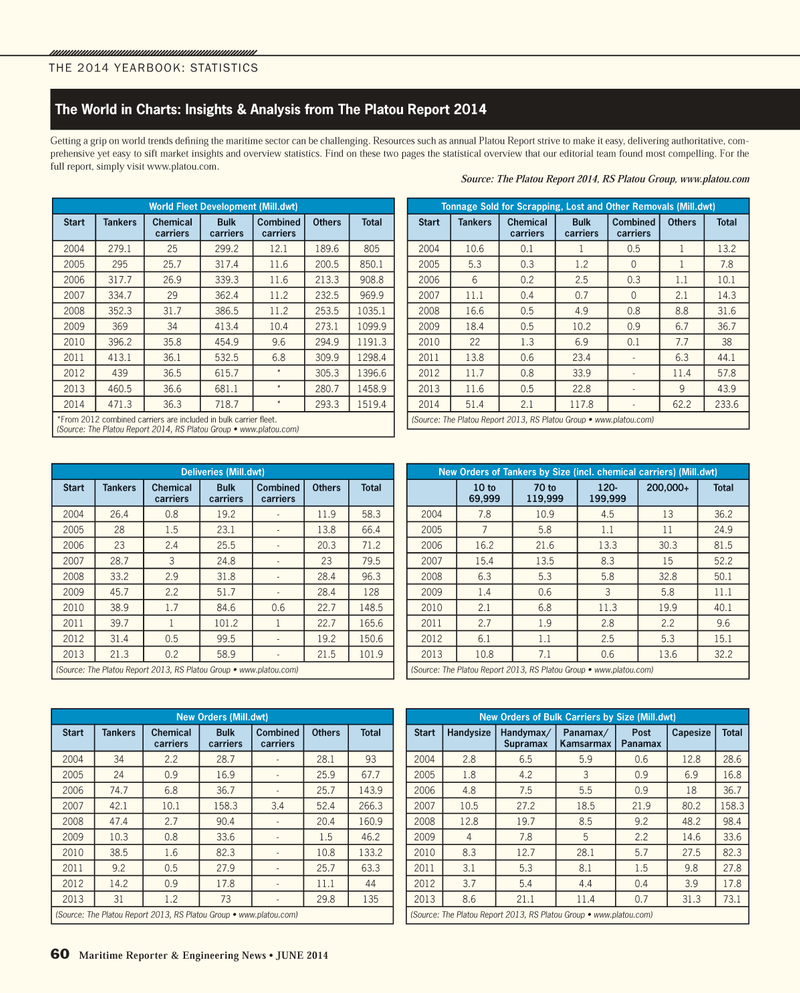
World Fleet Development (Mill.dwt)
Start Tankers Chemical carriers
Bulk carriers
Combined carriers
Others Total 2004 279.1 25 299.2 12.1 189.6 805 2005 295 25.7 317.4 11.6 200.5 850.1 2006 317.7 26.9 339.3 11.6 213.3 908.8 2007 334.7 29 362.4 11.2 232.5 969.9 2008 352.3 31.7 386.5 11.2 253.5 1035.1 2009 369 34 413.4 10.4 273.1 1099.9 2010 396.2 35.8 454.9 9.6 294.9 1191.3 2011 413.1 36.1 532.5 6.8 309.9 1298.4 2012 439 36.5 615.7 * 305.3 1396.6 2013 460.5 36.6 681.1 * 280.7 1458.9 2014 471.3 36.3 718.7 * 293.3 1519.4 *From 2012 combined carriers are included in bulk carrier fl eet. (Source: The Platou Report 2014, RS Platou Group • www.platou.com)
Deliveries (Mill.dwt)
Start Tankers Chemical carriers
Bulk carriers
Combined carriers
Others Total 2004 26.4 0.8 19.2 - 11.9 58.3 2005 28 1.5 23.1 - 13.8 66.4 2006 23 2.4 25.5 - 20.3 71.2 2007 28.7 3 24.8 - 23 79.5 2008 33.2 2.9 31.8 - 28.4 96.3 2009 45.7 2.2 51.7 - 28.4 128 2010 38.9 1.7 84.6 0.6 22.7 148.5 2011 39.7 1 101.2 1 22.7 165.6 2012 31.4 0.5 99.5 - 19.2 150.6 2013 21.3 0.2 58.9 - 21.5 101.9 (Source: The Platou Report 2013, RS Platou Group • www.platou.com)
New Orders (Mill.dwt)
Start Tankers Chemical carriers
Bulk carriers
Combined carriers
Others Total 2004 34 2.2 28.7 - 28.1 93 2005 24 0.9 16.9 - 25.9 67.7 2006 74.7 6.8 36.7 - 25.7 143.9 2007 42.1 10.1 158.3 3.4 52.4 266.3 2008 47.4 2.7 90.4 - 20.4 160.9 2009 10.3 0.8 33.6 - 1.5 46.2 2010 38.5 1.6 82.3 - 10.8 133.2 2011 9.2 0.5 27.9 - 25.7 63.3 2012 14.2 0.9 17.8 - 11.1 44 2013 31 1.2 73 - 29.8 135 (Source: The Platou Report 2013, RS Platou Group • www.platou.com)
Tonnage Sold for Scrapping, Lost and Other Removals (Mill.dwt)
Start Tankers Chemical carriers
Bulk carriers
Combined carriers
Others Total 2004 10.6 0.1 1 0.5 1 13.2 2005 5.3 0.3 1.2 0 1 7.8 2006 6 0.2 2.5 0.3 1.1 10.1 2007 11.1 0.4 0.7 0 2.1 14.3 2008 16.6 0.5 4.9 0.8 8.8 31.6 2009 18.4 0.5 10.2 0.9 6.7 36.7 2010 22 1.3 6.9 0.1 7.7 38 2011 13.8 0.6 23.4 - 6.3 44.1 2012 11.7 0.8 33.9 - 11.4 57.8 2013 11.6 0.5 22.8 - 9 43.9 2014 51.4 2.1 117.8 - 62.2 233.6 (Source: The Platou Report 2013, RS Platou Group • www.platou.com)
New Orders of Bulk Carriers by Size (Mill.dwt)
Start Handysize Handymax/
Supramax
Panamax/
Kamsarmax
Post
Panamax
Capesize Total 2004 2.8 6.5 5.9 0.6 12.8 28.6 2005 1.8 4.2 3 0.9 6.9 16.8 2006 4.8 7.5 5.5 0.9 18 36.7 2007 10.5 27.2 18.5 21.9 80.2 158.3 2008 12.8 19.7 8.5 9.2 48.2 98.4 2009 4 7.8 5 2.2 14.6 33.6 2010 8.3 12.7 28.1 5.7 27.5 82.3 2011 3.1 5.3 8.1 1.5 9.8 27.8 2012 3.7 5.4 4.4 0.4 3.9 17.8 2013 8.6 21.1 11.4 0.7 31.3 73.1 (Source: The Platou Report 2013, RS Platou Group • www.platou.com)
New Orders of Tankers by Size (incl. chemical carriers) (Mill.dwt) 10 to 69,999 70 to 119,999 120- 199,999 200,000+ Total 2004 7.8 10.9 4.5 13 36.2 2005 7 5.8 1.1 11 24.9 2006 16.2 21.6 13.3 30.3 81.5 2007 15.4 13.5 8.3 15 52.2 2008 6.3 5.3 5.8 32.8 50.1 2009 1.4 0.6 3 5.8 11.1 2010 2.1 6.8 11.3 19.9 40.1 2011 2.7 1.9 2.8 2.2 9.6 2012 6.1 1.1 2.5 5.3 15.1 2013 10.8 7.1 0.6 13.6 32.2 (Source: The Platou Report 2013, RS Platou Group • www.platou.com)
Getting a grip on world trends de? ning the maritime sector can be challenging. Resources such as annual Platou Report strive to make it easy, delivering authoritative, com- prehensive yet easy to sift market insights and overview statistics. Find on these two pages the statistical overview that our editorial team found most compelling. For the full report, simply visit www.platou.com.
Source: The Platou Report 2014, RS Platou Group, www.platou.com
The World in Charts: Insights & Analysis from The Platou Report 2014 60 Maritime Reporter & Engineering News • JUNE 2014
MR #6 (58-65).indd 60 6/9/2014 11:30:13 AM
