Page 41: of Maritime Reporter Magazine (June 2016)
Annual World Yearbook
Read this page in Pdf, Flash or Html5 edition of June 2016 Maritime Reporter Magazine
ing another contract for Glas Dowr was Redeployments could thus become se- tal of about 20 FPSOs being redeployed indicate retirals may become signi? cant- “challenging” to say the least. Street riously hazardous to the ? nancial health worldwide in the next ? ve years. ly higher in 2016.
talk signaled that conversion costs for of FPSO owners. Redeployment of FP- Twenty years after the Uisge Gorm The FPSO downturn in 2009 got peo- the new assignment ran over by about SOs had frequently become far more FPSO started producing in the North ple’s attention in the FPSO contractor a 100% over planned budget (? gures of complex in recent years than had been Sea, the world’s ? eet of FPSOs had community in Houston. I saw it ? rsthand $50 million reimbursed by oil company expected in the early days. Rigorous grown more than fourfold to something that year when I ? ew from Houston to and $195 million total expended give an management discipline in tackling these like 218, counting FPSOs that are opera- Singapore to chair and speak at the 2009 idea of the magnitude of work). redeployments became crucial – even tional plus these still under construction FPSO Congress. Leaving Houston the
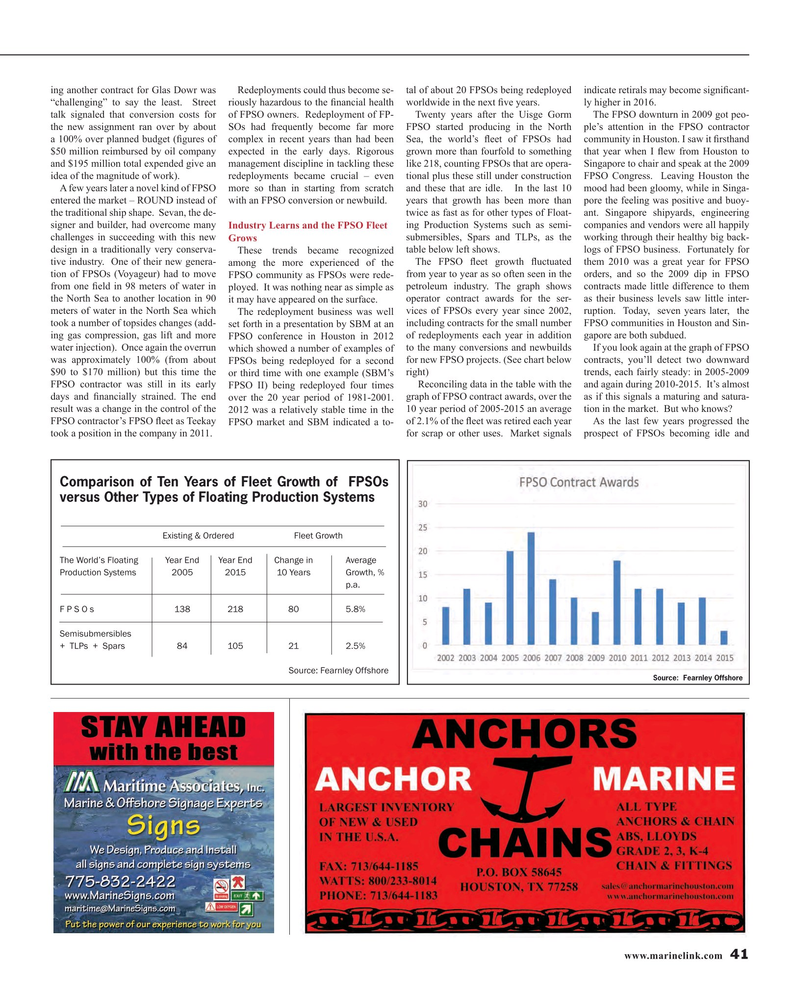
A few years later a novel kind of FPSO more so than in starting from scratch and these that are idle. In the last 10 mood had been gloomy, while in Singa- entered the market – ROUND instead of with an FPSO conversion or newbuild. years that growth has been more than pore the feeling was positive and buoy- the traditional ship shape. Sevan, the de- twice as fast as for other types of Float- ant. Singapore shipyards, engineering signer and builder, had overcome many Industry Learns and the FPSO Fleet ing Production Systems such as semi- companies and vendors were all happily challenges in succeeding with this new Grows submersibles, Spars and TLPs, as the working through their healthy big back- design in a traditionally very conserva- These trends became recognized table below left shows. logs of FPSO business. Fortunately for tive industry. One of their new genera- among the more experienced of the The FPSO ? eet growth ? uctuated them 2010 was a great year for FPSO tion of FPSOs (Voyageur) had to move FPSO community as FPSOs were rede- from year to year as so often seen in the orders, and so the 2009 dip in FPSO from one ? eld in 98 meters of water in ployed. It was nothing near as simple as petroleum industry. The graph shows contracts made little difference to them the North Sea to another location in 90 it may have appeared on the surface. operator contract awards for the ser- as their business levels saw little inter- meters of water in the North Sea which The redeployment business was well vices of FPSOs every year since 2002, ruption. Today, seven years later, the took a number of topsides changes (add- set forth in a presentation by SBM at an including contracts for the small number FPSO communities in Houston and Sin- ing gas compression, gas lift and more FPSO conference in Houston in 2012 of redeployments each year in addition gapore are both subdued.
water injection). Once again the overrun which showed a number of examples of to the many conversions and newbuilds If you look again at the graph of FPSO was approximately 100% (from about FPSOs being redeployed for a second for new FPSO projects. (See chart below contracts, you’ll detect two downward $90 to $170 million) but this time the or third time with one example (SBM’s right) trends, each fairly steady: in 2005-2009
FPSO contractor was still in its early FPSO II) being redeployed four times Reconciling data in the table with the and again during 2010-2015. It’s almost days and ? nancially strained. The end over the 20 year period of 1981-2001. graph of FPSO contract awards, over the as if this signals a maturing and satura- result was a change in the control of the 2012 was a relatively stable time in the 10 year period of 2005-2015 an average tion in the market. But who knows?
FPSO contractor’s FPSO ? eet as Teekay FPSO market and SBM indicated a to- of 2.1% of the ? eet was retired each year As the last few years progressed the took a position in the company in 2011. for scrap or other uses. Market signals prospect of FPSOs becoming idle and
Comparison of Ten Years of Fleet Growth of FPSOs versus Other Types of Floating Production Systems Existing & Ordered Fleet Growth
The World’s Floating Year End Year End Change in Average
Production Systems 2005 2015 10 Years Growth, % p.a.
F P S O s 138 218 80 5.8%
Semisubmersibles + TLPs + Spars 84 105 21 2.5%
Source: Fearnley Offshore
Source: Fearnley Offshore www.marinelink.com 41
MR #6 (34-41).indd 41 6/6/2016 1:50:17 PM

 40
40

 42
42
