
Page 77: of Maritime Reporter Magazine (June 2016)
Annual World Yearbook
Read this page in Pdf, Flash or Html5 edition of June 2016 Maritime Reporter Magazine
 76
76
 78
78
DATA & STATISTICS
Freight Facts & Figures 2015:
The Bureau of Transportation Statistics (BTS) Weighs in.
The 11th edition of the BTS Freight Facts and Fig- ways continue to account for more than 98 percent of all ures is an in-depth 111-page report touches upon on the U.S. ? ag vessels.
volume and value of U.S. freight; condition and perfor- Locks make it easier for vessels to navigate U.S. Rivers, mance of transport infrastructure; economic conditions, but increasing traf? c and aging locks create massive delays and the safety, energy, and environmental implications of while locks are shut down for maintenance/repair. The av- freight. That’s a mouthful. The document, intended to erage age of all locks in 2014 was a whopping 59 years. help decision makers and planners understand the im- Between 2000 and 2014, average delay per lockage nearly portance of transportation metrics, discusses all modes of doubled from 64 minutes to 121 minutes. In 2014, the transport. At MarineNews, we’ll focus on the waterfront. highest average lockage delay was on the Tennessee River
We’ll start with Energy: Texas was the largest oil pro- at 277 minutes, while the Gulf Intracoastal Waterway had ducing state in 2014, while North Dakota is the fastest the highest percent of vessels delayed at 90. Time is money.
growing oil producer. North Dakota produced 397 mil- The top 25 water ports by tonnage handled 68.5 per- lion barrels, or 12.5 percent of total U.S. production. cent of the weight of all domestic and foreign goods moved
Expanded U.S. oil production and changes in where oil by water. Notably, from 2006 to 2011, the number of calls is produced have increased the use of rail and barges to by containership with capacities of 5,000 TEUs or more move oil to re? neries and terminals for distribution to increased by 78 percent. These boxships accounted for 27 consumers. Although pipelines continue to be the pre- percent of total containership calls at U.S. ports in 2011, dominant transport mode, tankers and barges move up from 17 percent in 2006. Beyond this, the average ves- crude oil on U.S. inland waterways, from port to port sel size per call at U.S. ports increased from 50,653 DWT and on the Great Lakes. The use of tankers and barges tons in 2006 to 53,832 DWT in 2011, or about 6 percent. for oil transport has risen from 2.1 percent in the ? rst 6 The average size of containerships increased by 13 percent months of 2010 to 3.2 percent in the ? rst 6 months of (TEU’s) and (9.9 percent (DWT). As the Panama Canal 2015. … Still – we could be using our waterways more nears completion of its historic expansion, the above met- often, and more ef? ciently. rics will only widen. That’s good news for domestic dredgers.
Vessels: The age of the domestic ? eet has decreased Shortsea Shipping: Assuming no change in network measurably since 2000. That’s the good news. Inland capacity, the number of miles with recurring congestion barges accounted for the largest share (78%) of U.S. ves- and the number of large trucks is forecast to increase sig- sels. Towboats are the oldest vessels with 69 percent older ni? cantly between 2011 and 2040. On highways carrying than 25 years. As the subchapter M towboat rules loom more than 8,500 trucks per day, recurring congestion will just around the corner, the age of that ? eet might make slow traf? c on close to 7,400 miles and create stop-and-go shipyards happy as they look forward to more repair/ conditions on an additional 22,000 miles. Opportunities newbuild work, but probably gives operators heartburn abound for shortsea entrepreneurs.
as they ponder what to do in a challenging market and a
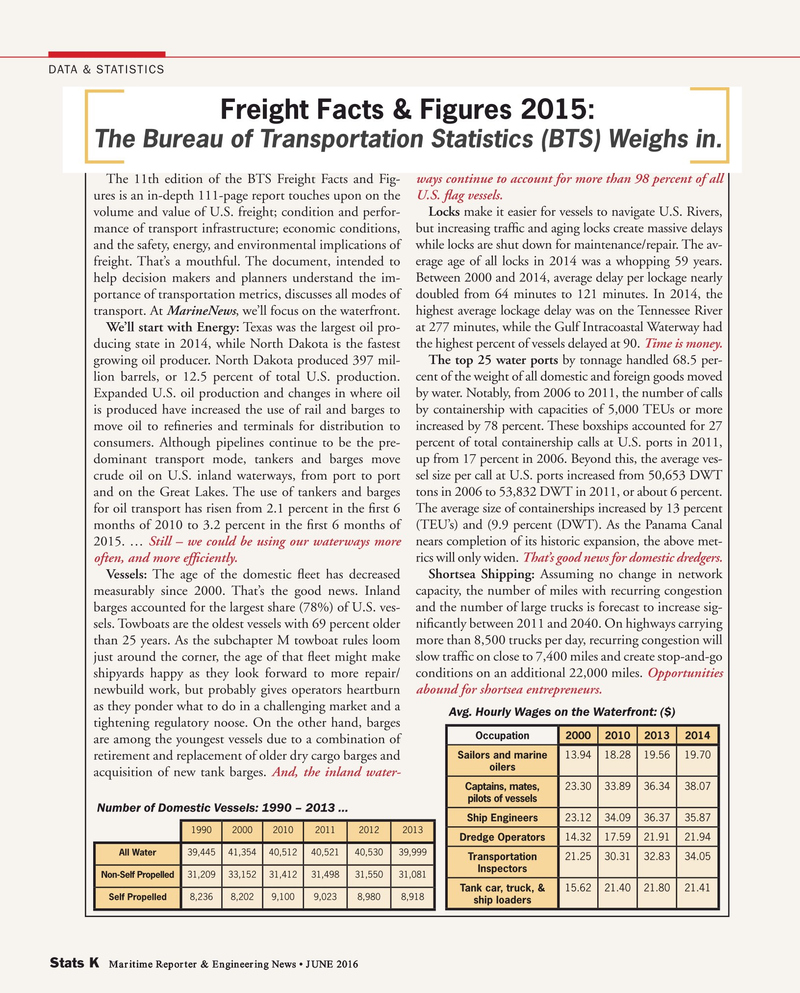
Avg. Hourly Wages on the Waterfront: ($) tightening regulatory noose. On the other hand, barges
Occupation2000201020132014 are among the youngest vessels due to a combination of
Sailors and marine 13.9418.2819.5619.70 retirement and replacement of older dry cargo barges and oilers acquisition of new tank barges. And, the inland water-
Captains, mates, 23.3033.8936.3438.07 pilots of vessels
Number of Domestic Vessels: 1990 – 2013 …
Ship Engineers 23.1234.0936.3735.87 199020002010201120122013
Dredge Operators 14.3217.5921.9121.94
All Water 39,44541,35440,51240,52140,53039,999
Transportation 21.2530.3132.8334.05
Inspectors
Non-Self Propelled 31,20933,15231,41231,49831,55031,081
Tank car, truck, & 15.6221.4021.8021.41
Self Propelled 8,2368,2029,1009,0238,9808,918 ship loaders
Stats K Maritime Reporter & Engineering News • JUNE 2016
STATS II.indd 36 STATS II.indd 36 6/20/2016 5:04:05 PM6/20/2016 5:04:05 PM
MN Mar16 Layout 1-17.indd 8 2/19/2016 10:38:27 AM
