Page 81: of Maritime Reporter Magazine (June 2016)
Annual World Yearbook
Read this page in Pdf, Flash or Html5 edition of June 2016 Maritime Reporter Magazine
DATA & STATISTICS
Green Waterways and the Bureau of
Transportation Statistics
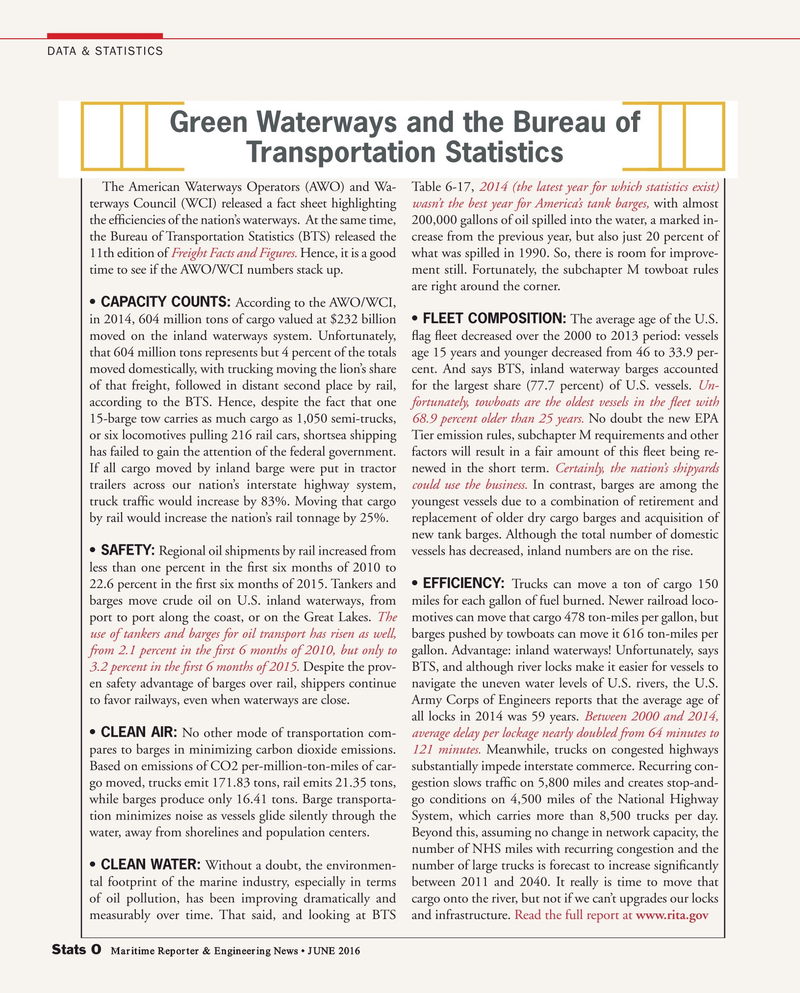
The American Waterways Operators (AWO) and Wa- Table 6-17, 2014 (the latest year for which statistics exist) terways Council (WCI) released a fact sheet highlighting wasn’t the best year for America’s tank barges, with almost the ef? ciencies of the nation’s waterways. At the same time, 200,000 gallons of oil spilled into the water, a marked in- the Bureau of Transportation Statistics (BTS) released the crease from the previous year, but also just 20 percent of 11th edition of Freight Facts and Figures. Hence, it is a good what was spilled in 1990. So, there is room for improve- time to see if the AWO/WCI numbers stack up. ment still. Fortunately, the subchapter M towboat rules are right around the corner.
• CAPACITY COUNTS: According to the AWO/WCI, in 2014, 604 million tons of cargo valued at $232 billion • FLEET COMPOSITION: The average age of the U.S. moved on the inland waterways system. Unfortunately, ? ag ? eet decreased over the 2000 to 2013 period: vessels that 604 million tons represents but 4 percent of the totals age 15 years and younger decreased from 46 to 33.9 per- moved domestically, with trucking moving the lion’s share cent. And says BTS, inland waterway barges accounted of that freight, followed in distant second place by rail, for the largest share (77.7 percent) of U.S. vessels. Un- according to the BTS. Hence, despite the fact that one fortunately, towboats are the oldest vessels in the ? eet with 15-barge tow carries as much cargo as 1,050 semi-trucks, 68.9 percent older than 25 years. No doubt the new EPA or six locomotives pulling 216 rail cars, shortsea shipping Tier emission rules, subchapter M requirements and other has failed to gain the attention of the federal government. factors will result in a fair amount of this ? eet being re-
If all cargo moved by inland barge were put in tractor newed in the short term. Certainly, the nation’s shipyards trailers across our nation’s interstate highway system, could use the business. In contrast, barges are among the truck traf? c would increase by 83%. Moving that cargo youngest vessels due to a combination of retirement and by rail would increase the nation’s rail tonnage by 25%. replacement of older dry cargo barges and acquisition of new tank barges. Although the total number of domestic • SAFETY: Regional oil shipments by rail increased from vessels has decreased, inland numbers are on the rise.
less than one percent in the ? rst six months of 2010 to 22.6 percent in the ? rst six months of 2015. Tankers and • EFFICIENCY: Trucks can move a ton of cargo 150 barges move crude oil on U.S. inland waterways, from miles for each gallon of fuel burned. Newer railroad loco- port to port along the coast, or on the Great Lakes. The motives can move that cargo 478 ton-miles per gallon, but use of tankers and barges for oil transport has risen as well, barges pushed by towboats can move it 616 ton-miles per from 2.1 percent in the ? rst 6 months of 2010, but only to gallon. Advantage: inland waterways! Unfortunately, says 3.2 percent in the ? rst 6 months of 2015. Despite the prov- BTS, and although river locks make it easier for vessels to en safety advantage of barges over rail, shippers continue navigate the uneven water levels of U.S. rivers, the U.S. to favor railways, even when waterways are close. Army Corps of Engineers reports that the average age of all locks in 2014 was 59 years. Between 2000 and 2014, • CLEAN AIR: No other mode of transportation com- average delay per lockage nearly doubled from 64 minutes to pares to barges in minimizing carbon dioxide emissions. 121 minutes. Meanwhile, trucks on congested highways
Based on emissions of CO2 per-million-ton-miles of car- substantially impede interstate commerce. Recurring con- go moved, trucks emit 171.83 tons, rail emits 21.35 tons, gestion slows traf? c on 5,800 miles and creates stop-and- while barges produce only 16.41 tons. Barge transporta- go conditions on 4,500 miles of the National Highway tion minimizes noise as vessels glide silently through the System, which carries more than 8,500 trucks per day. water, away from shorelines and population centers. Beyond this, assuming no change in network capacity, the number of NHS miles with recurring congestion and the • CLEAN WATER: Without a doubt, the environmen- number of large trucks is forecast to increase signi? cantly tal footprint of the marine industry, especially in terms between 2011 and 2040. It really is time to move that of oil pollution, has been improving dramatically and cargo onto the river, but not if we can’t upgrades our locks measurably over time. That said, and looking at BTS and infrastructure. Read the full report at www.rita.gov
Stats O Maritime Reporter & Engineering News • JUNE 2016
STATS II.indd 40 STATS II.indd 40 6/20/2016 5:05:36 PM6/20/2016 5:05:36 PM
MN June16 Layout 1-17.indd 8 5/17/2016 11:21:11 AM

 80
80

 82
82
