Page 50: of Maritime Reporter Magazine (November 2016)
Workboat Edition
Read this page in Pdf, Flash or Html5 edition of November 2016 Maritime Reporter Magazine
MARINE SCIENCE
A Colorful View from Space
Connecting Color to Phytoplankton with Novel Field Technology
By Kira Coley n ever-changing patch- tection and tracking of Harmful Algal struments into the water column to mea- chlorophyll had increased by three-fold. work of blues and greens, Blooms (HAB), as well as mapping of sure various parameters such as salinity, We went back to try to ? nd out what the sea is a colorful blend ecological boundaries for implementing temperature, and optical signatures at caused this and connected it to the melt-
Aof suspended particles and management approaches for sustainable multiple depths sometimes up to thou- ing snow caps in the Himalayas region. the pigments of phytoplankton. While ? sheries, are just two of the many ben- sands of meters. Because we are limited The snow caps were getting thinner, microscopic in size, these tiny ocean- e? ts of ocean color imagery. Due to the by ship time, man power and money, and their extent was shrinking because dwelling plants in? uence climate and vast expanse of water covering 70% of we cannot sample every single meter of of which, the intensity of the monsoons the atmosphere and form the base of the the Earth’s surface, scientist’s efforts to the ocean. So, we rely on the satellites had increased, causing increased upwell- marine food web. Satellite-based ocean collect data are limited in both time and to give us an accurate global picture and ing of nutrients required by phytoplank- color imagery captures the vibrant world space. For this reason, satellite-based use the data collected out in the ? eld to ton. From these ocean color images, we of phytoplankton and their relationship observations are important in providing make sure the satellite data matches the predicted that the Arabian Sea would with the marine environment. As we en- a global view of biological activity and ? eld data as much as possible. We call slowly become hypoxic over time, and ter the human-in? uenced age, our foot- monitoring how the hues of the ocean this ground-truthing.” that’s what we have been observing now. print on the variegated ocean can be seen change over time. Prof. Joaquim Goes, a biological It was here that working with the Flow- from land and space as shifting climates, As part of the NASA Goddard Space oceanographer from Columbia Univer- Cam started to interest me.” pollution and excess nutrients cause Flight Center, the Ocean Ecology Labo- sity Earth Observatory, researches the Goes and his team needed technology changes within planktonic communities ratory Field Group uses information col- effects of climate change on ocean eco- to assist with onboard analysis to make and impact the surrounding ecosystem. lected at sea to validate data gathered systems. His work extends across the quick and easy measurements of water
The arrival of new high-resolution ? eld from satellites. Research cruises obtain world’s ocean basins from the Paci? c to samples. During one of the cruises to the technology opens the door to the next accurate optical, biological and biogeo- the Atlantic and the Indian Ocean. For Arabian Sea, the team operated Flow- generation of satellite-based sensors chemical data. In situ radiometers mea- most of his research, he relies on ocean Cam – a particle analysis instrument which help scientists understand how sure ocean color and allow scientists color images to understand how climate from Fluid Imaging Technologies using these organisms are responding to the to compare the results to images from change in? uences the structure and func- digital imaging to measure particle size changing climate and what this means space. tioning of plankton ecosystems, driving and shape of plankton cells – taking dis- for the health of our oceans. Aimee Neeley, a lead research scientist local- and basin-scale biological oceano- creet samples at each survey location. The color of light that is scattered at NASA’s Ocean Ecology Laboratory graphic processes. Measuring some 40 parameters within back out of the sea can be used to de- Field Group explains, “Out in the ? eld, In 2005, Goes began studying the ef- each image, the plankton community of rive information about what is in the oceanographers typically sample from fects of the monsoons on phytoplankton a sample can be quickly assessed. water column, including the type and speci? c, pre-planned locations called within the Arabian Sea, “We noticed that The team was able to identify the or- abundance of phytoplankton. The de- ‘Stations.’ At these stations, we send in- through these ocean color images, that ganism causing the blooms and, within
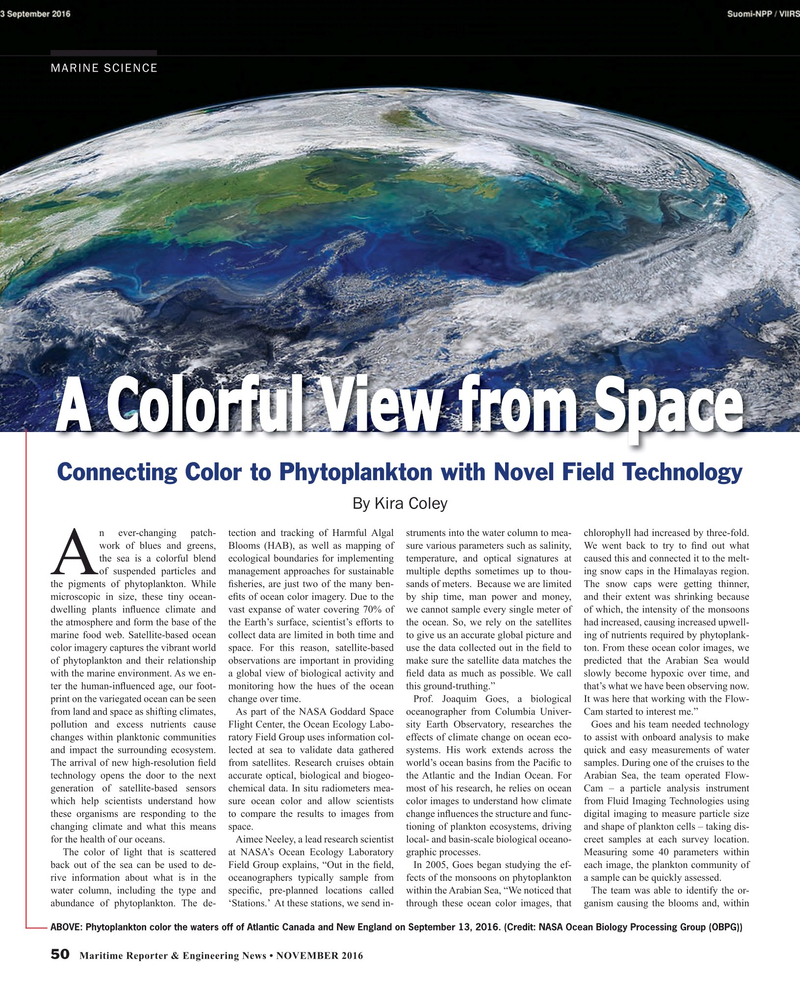
ABOVE: Phytoplankton color the waters off of Atlantic Canada and New England on September 13, 2016. (Credit: NASA Ocean Biology Processing Group (OBPG)) 50 Maritime Reporter & Engineering News • NOVEMBER 2016
MR #11 (50-57).indd 50 11/3/2016 5:36:17 PM

 49
49

 51
51
