Page 46: of Maritime Reporter Magazine (August 2017)
The Shipyard Edition
Read this page in Pdf, Flash or Html5 edition of August 2017 Maritime Reporter Magazine
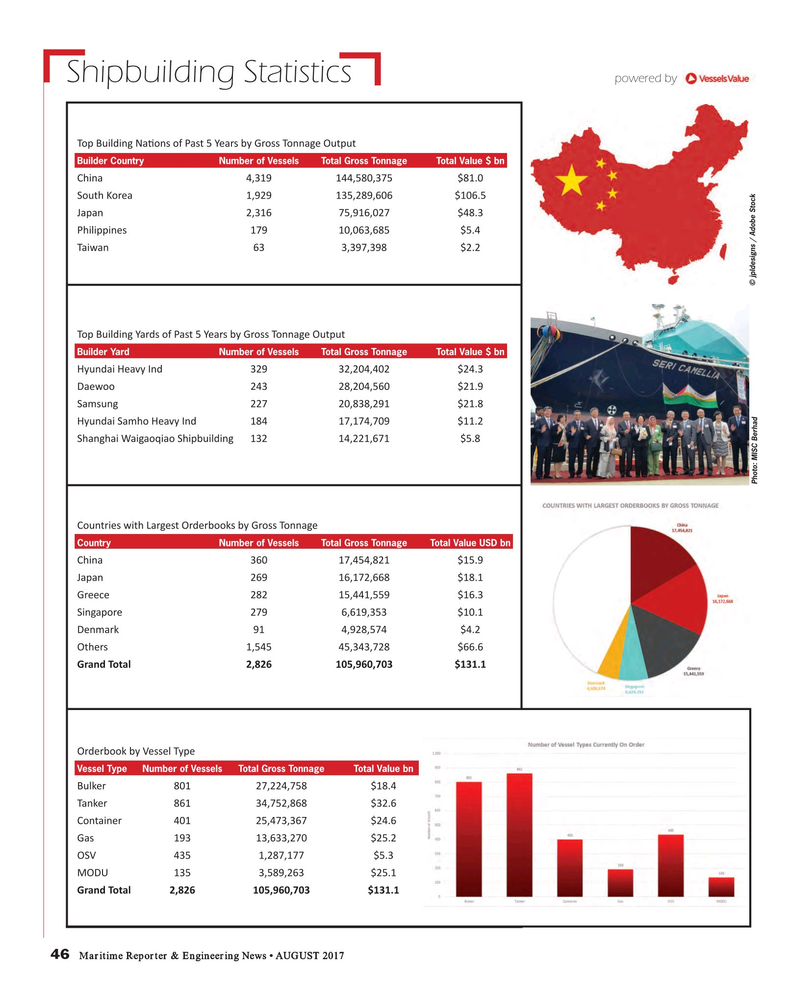
Shipbuilding Statistics powered by
Top Building Nat ons of Past 5 Years by Gross Tonnage Output
Builder Country Number of Vessels Total Gross Tonnage Total Value $ bn $81.0 China 4,319 144,580,375
South Korea 1,929 135,289,606 $106.5 $48.3 Japan 2,316 75,916,027
Philippines 179 10,063,685 $5.4 $2.2 Taiwan 63 3,397,398 © jpldesigns / Adobe Stock
Top Building Yards of Past 5 Years by Gross Tonnage Output
Builder Yard Number of Vessels Total Gross Tonnage Total Value $ bn
Hyundai Heavy Ind 329 32,204,402 $24.3 $21.9 Daewoo 243 28,204,560 $21.8 Samsung 227 20,838,291
Hyundai Samho Heavy Ind 184 17,174,709 $11.2
Shanghai Waigaoqiao Shipbuilding 132 14,221,671 $5.8
Photo: MISC Berhad
Countries with Largest Orderbooks by Gross Tonnage
Country Number of Vessels Total Gross Tonnage Total Value USD bn $15.9 China 360 17,454,821 $18.1 Japan 269 16,172,668 $16.3 Greece 282 15,441,559 $10.1 Singapore 279 6,619,353 $4.2 Denmark 91 4,928,574 $66.6 Others 1,545 45,343,728
Grand Total 2,826 105,960,703 $131.1
Orderbook by Vessel Type
Vessel Type Number of Vessels Total Gross Tonnage Total Value bn
Bulker 801 27,224,758 $18.4
Tanker 861 34,752,868 $32.6
Container 401 25,473,367 $24.6
Gas 193 13,633,270 $25.2
OSV 435 1,287,177 $5.3
MODU 135 3,589,263 $25.1
Grand Total 2,826 105,960,703 $131.1 46 Maritime Reporter & Engineering News • AUGUST 2017
MR #8 (42-49).indd 46 MR #8 (42-49).indd 46 8/4/2017 11:45:56 AM8/4/2017 11:45:56 AM

 45
45

 47
47
