
Page 67: of Maritime Reporter Magazine (August 2017)
The Shipyard Edition
Read this page in Pdf, Flash or Html5 edition of August 2017 Maritime Reporter Magazine
 66
66
 68
68
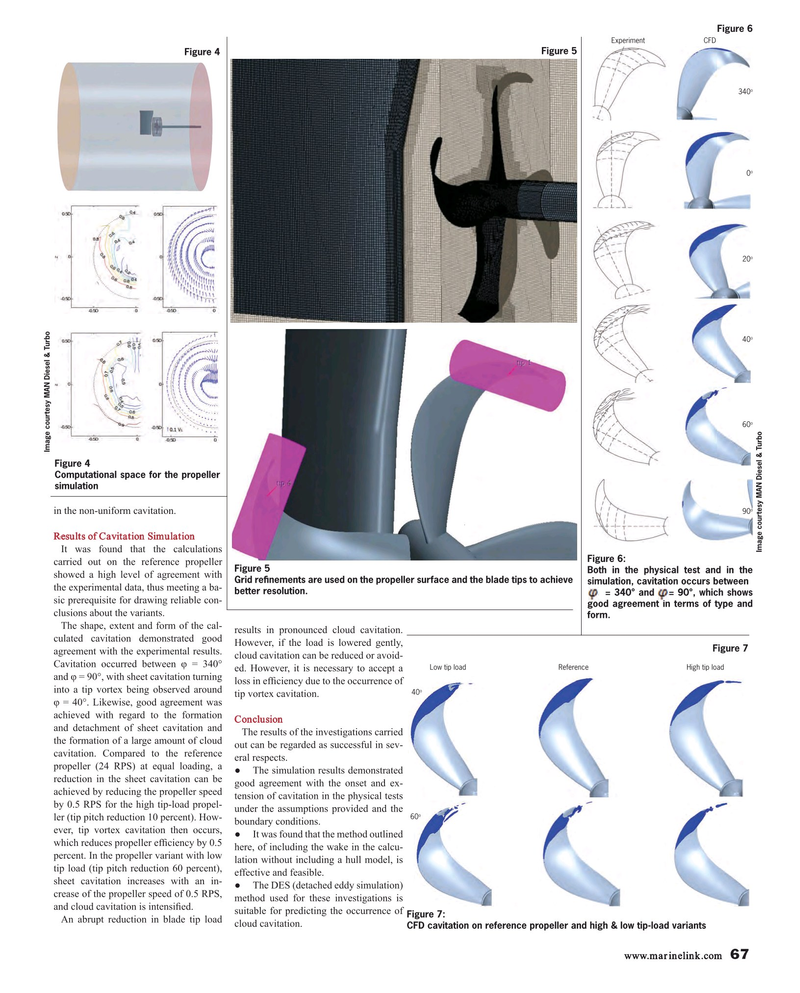
Figure 6 Experiment CFD
Figure 5
Figure 4 o 340 o 0 o 20 o 40 o 60
Image courtesy MAN Diesel & Turbo
Figure 4
Computational space for the propeller simulation o 90 in the non-uniform cavitation.
Results of Cavitation Simulation
Image courtesy MAN Diesel & Turbo
It was found that the calculations
Figure 6: carried out on the reference propeller
Figure 5
Both in the physical test and in the showed a high level of agreement with
Grid re? nements are used on the propeller surface and the blade tips to achieve simulation, cavitation occurs between the experimental data, thus meeting a ba- better resolution.
= 340° and = 90°, which shows sic prerequisite for drawing reliable con- good agreement in terms of type and clusions about the variants.
form.
The shape, extent and form of the cal- culated cavitation demonstrated good results in pronounced cloud cavitation.
However, if the load is lowered gently,
Figure 7 agreement with the experimental results. cloud cavitation can be reduced or avoid-
Cavitation occurred between f = 340° ed. However, it is necessary to accept a Low tip load Reference High tip load and f = 90°, with sheet cavitation turning loss in ef? ciency due to the occurrence of o into a tip vortex being observed around tip vortex cavitation.
40 f = 40°. Likewise, good agreement was achieved with regard to the formation Conclusion and detachment of sheet cavitation and
The results of the investigations carried the formation of a large amount of cloud out can be regarded as successful in sev- cavitation. Compared to the reference eral respects.
propeller (24 RPS) at equal loading, a ? The simulation results demonstrated reduction in the sheet cavitation can be good agreement with the onset and ex- achieved by reducing the propeller speed tension of cavitation in the physical tests by 0.5 RPS for the high tip-load propel- under the assumptions provided and the o 60 ler (tip pitch reduction 10 percent). How- boundary conditions.
ever, tip vortex cavitation then occurs, ? It was found that the method outlined which reduces propeller ef? ciency by 0.5 here, of including the wake in the calcu- percent. In the propeller variant with low lation without including a hull model, is tip load (tip pitch reduction 60 percent), effective and feasible.
sheet cavitation increases with an in- ? The DES (detached eddy simulation) crease of the propeller speed of 0.5 RPS, method used for these investigations is and cloud cavitation is intensi? ed.
suitable for predicting the occurrence of
Figure 7:
An abrupt reduction in blade tip load cloud cavitation.
CFD cavitation on reference propeller and high & low tip-load variants www.marinelink.com 67
MR #8 (66-73).indd 67 MR #8 (66-73).indd 67 8/7/2017 3:27:45 PM8/7/2017 3:27:45 PM
