
Page 21: of Offshore Engineer Magazine (Jul/Aug 2013)
Read this page in Pdf, Flash or Html5 edition of Jul/Aug 2013 Offshore Engineer Magazine
 20
20
 22
22
Perspectives and appraisal (E&A)
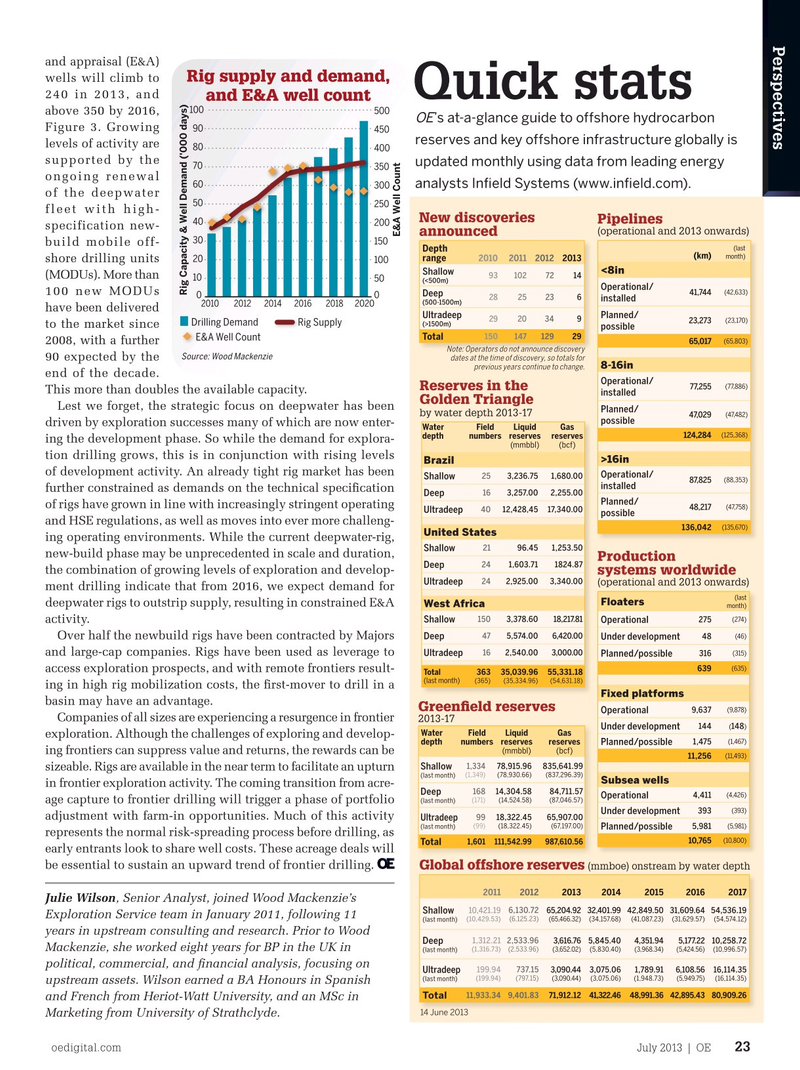
Rig supply and demand, wells will climb to 240 in 2013, and
Quick stats and E&A well count 100 500 above 350 by 2016,
OE ’s at-a-glance guide to offshore hydrocarbon
Figure 3. Growing 90 450 reserves and key offshore infrastructure globally is levels of activity are 80 400 supported by the updated monthly using data from leading energy 70 350 ongoing renewal 60 analysts Infeld Systems (www.infeld.com).
300 of the deepwater 50 250 fleet with high-
New discoveries Pipelines 40 200 specification new- (operational and 2013 onwards) announced
E&A Well Count 30 150 build mobile off- (last
Depth (km) month) 2010 2011 2012 2013 20 range shore drilling units 100 <8in
Shallow 93 102 72 14 (MODUs). More than 10 50 (<500m)
Operational/ (42,633) 100 new MODUs 41,744
Rig Capacity & Well Demand ('000 days)
Deep 0 0 28 25 23 6 installed (500-1500m) 2010 2012 2014 2016 2018 2020 have been delivered
Ultradeep Planned/ 29 20 34 9 (23,170) 23,273
Drilling Demand Rig Supply (>1500m) to the market since possible 150 147 129 29
Total
E&A Well Count (65,803) 65,017 2008, with a further
Note: Operators do not announce discovery
Source: Wood Mackenzie 90 expected by the dates at the time of discovery, so totals for 8-16in previous years continue to change.
end of the decade.
Operational/ (77,886) 77,255
Reserves in the
This more than doubles the available capacity. installed
Golden Triangle
Lest we forget, the strategic focus on deepwater has been
Planned/ by water depth 2013-17 (47,482) 47,029 possible driven by exploration successes many of which are now enter-
Water Field Liquid Gas (125,368) 124,284 depth numbers reserves reserves ing the development phase. So while the demand for explora- (mmbbl) (bcf) tion drilling grows, this is in conjunction with rising levels
Brazil >16in of development activity. An already tight rig market has been
Operational/ 25 3,236.75 1,680.00
Shallow (88,353) 87,825 installed further constrained as demands on the technical specifcation
Deep 16 3,257.00 2,255.00
Planned/ of rigs have grown in line with increasingly stringent operating (47,758) 48,217 40 12,428,45 17,340.00
Ultradeep possible and HSE regulations, as well as moves into ever more challeng- (135,670) 136,042
United States ing operating environments. While the current deepwater-rig, 21 96.45 1,253.50
Shallow new-build phase may be unprecedented in scale and duration,
Production 24 1,603.71 1824.87
Deep the combination of growing levels of exploration and develop- systems worldwide 24 2,925.00 3,340.00
Ultradeep (operational and 2013 onwards) ment drilling indicate that from 2016, we expect demand for (last
Floaters deepwater rigs to outstrip supply, resulting in constrained E&A
West Africa month) (274) 150 3,378.60 18,217.81 275
Shallow Operational activity. (46) 47 5,574.00 6,420.00 48
Deep Under development
Over half the newbuild rigs have been contracted by Majors 16 2,540.00 3,000.00 316 (315) and large-cap companies. Rigs have been used as leverage to
Ultradeep Planned/possible (635) 639 access exploration prospects, and with remote frontiers result-
Total 363 35,039.96 55,331.18 (last month) (365) (35,334.96) (54,631.18) ing in high rig mobilization costs, the frst-mover to drill in a
Fixed platforms basin may have an advantage.
Greenfeld reserves (9,878) 9,637
Operational
Companies of all sizes are experiencing a resurgence in frontier 2013-17 144 148 ( )
Under development
Water Field Liquid Gas exploration. Although the challenges of exploring and develop- (1,467) 1,475 depth numbers reserves reserves
Planned/possible (mmbbl) (bcf) ing frontiers can suppress value and returns, the rewards can be (11,493) 11,256 1,334 78,915.96 835,641.99
Shallow sizeable. Rigs are available in the near term to facilitate an upturn (last month) (1,349) (78,930.66) (837,296.39)
Subsea wells in frontier exploration activity. The coming transition from acre-
Deep 168 14,304.58 84,711.57 (4,426) 4,411
Operational (last month) (171) (14,524.58) (87,046.57) age capture to frontier drilling will trigger a phase of portfolio (393) 393
Under development adjustment with farm-in opportunities. Much of this activity 99 18,322.45 65,907.00
Ultradeep (last month) (99) (18,322.45) (67,197.00) (5,981) 5,981
Planned/possible represents the normal risk-spreading process before drilling, as (10,800) 10,765 1,601 111,542.99 987,610.56
Total early entrants look to share well costs. These acreage deals will be essential to sustain an upward trend of frontier drilling.
Global offshore reserves (mmboe) onstream by water depth 2011 2012 201320142015 20162017
Julie Wilson, Senior Analyst, joined Wood Mackenzie’s 10,421.19 6,130.72 65,204.92 32,401.99 42,849.50 31,609.6454,536.19
Shallow
Exploration Service team in January 2011, following 11 (last month) (10,429.53) (6,125.23) (65,466.32) (34,157.68) (41,087.23) (31,629.57) (54,574.12) years in upstream consulting and research. Prior to Wood
Deep 1,312.212,533.96 3,616.76 5,845.40 4,351.94 5,177.22 10,258.72
Mackenzie, she worked eight years for BP in the UK in (last month) (1,316.73) (2,533.96) (3,652.02) (5,830.40) (3,968.34) (5,424.56) (10,996.57) political, commercial, and fnancial analysis, focusing on 199.94 737.15 3,090.44 3,075.06 1,789.91 6,108.56 16,114.35
Ultradeep (last month) (199.94) (797.15) (3,090.44) (3,075.06) (1,948.73) (5,949.75) (16,114.35) upstream assets. Wilson earned a BA Honours in Spanish 11,933.34 9,401.83 71,912.12 41,322.46 48,991.36 42,895.43 80,909.26
Total and French from Heriot-Watt University, and an MSc in 14 June 2013
Marketing from University of Strathclyde.
oedigital.com July 2013 | OE 23
Analysis_WoodMac_Quickstats.indd 23 7/8/13 5:32 PM