
Page 29: of Offshore Engineer Magazine (Jul/Aug 2013)
Read this page in Pdf, Flash or Html5 edition of Jul/Aug 2013 Offshore Engineer Magazine
 28
28
 30
30
Remote Technology
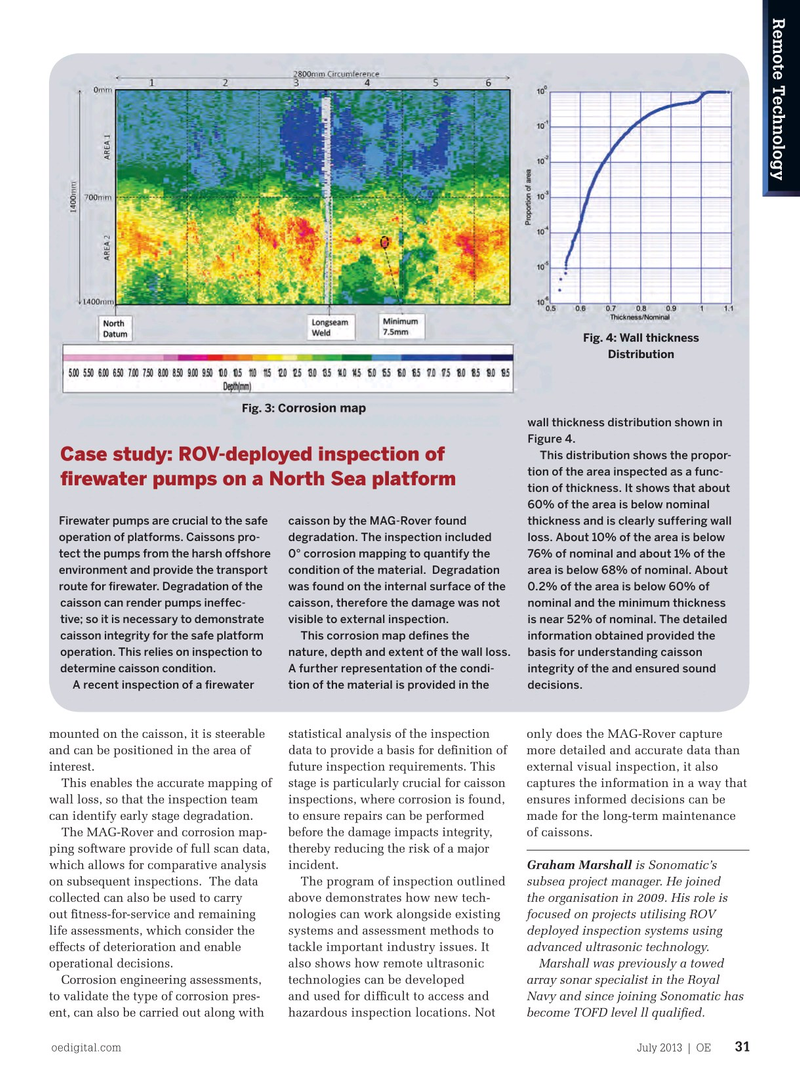
Fig. 4: Wall thickness
Distribution
Fig. 3: Corrosion map wall thickness distribution shown in
Figure 4.
This distribution shows the propor-
Case study: ROV-deployed inspection of tion of the area inspected as a func- frewater pumps on a North Sea platform tion of thickness. It shows that about 60% of the area is below nominal
Firewater pumps are crucial to the safe caisson by the MAG-Rover found thickness and is clearly suffering wall operation of platforms. Caissons pro- degradation. The inspection included loss. About 10% of the area is below tect the pumps from the harsh offshore 0° corrosion mapping to quantify the 76% of nominal and about 1% of the environment and provide the transport condition of the material. Degradation area is below 68% of nominal. About route for frewater. Degradation of the was found on the internal surface of the 0.2% of the area is below 60% of caisson can render pumps ineffec- caisson, therefore the damage was not nominal and the minimum thickness tive; so it is necessary to demonstrate visible to external inspection. is near 52% of nominal. The detailed caisson integrity for the safe platform This corrosion map defnes the information obtained provided the operation. This relies on inspection to nature, depth and extent of the wall loss. basis for understanding caisson determine caisson condition. A further representation of the condi- integrity of the and ensured sound
A recent inspection of a frewater tion of the material is provided in the decisions.
mounted on the caisson, it is steerable statistical analysis of the inspection only does the MAG-Rover capture and can be positioned in the area of data to provide a basis for defnition of more detailed and accurate data than interest. future inspection requirements. This external visual inspection, it also
This enables the accurate mapping of stage is particularly crucial for caisson captures the information in a way that wall loss, so that the inspection team inspections, where corrosion is found, ensures informed decisions can be can identify early stage degradation. to ensure repairs can be performed made for the long-term maintenance
The MAG-Rover and corrosion map- before the damage impacts integrity, of caissons. ping software provide of full scan data, thereby reducing the risk of a major which allows for comparative analysis incident. Graham Marshall is Sonomatic’s on subsequent inspections. The data The program of inspection outlined subsea project manager. He joined collected can also be used to carry above demonstrates how new tech- the organisation in 2009. His role is out ftness-for-service and remaining nologies can work alongside existing focused on projects utilising ROV life assessments, which consider the systems and assessment methods to deployed inspection systems using effects of deterioration and enable tackle important industry issues. It advanced ultrasonic technology.
operational decisions. also shows how remote ultrasonic Marshall was previously a towed
Corrosion engineering assessments, technologies can be developed array sonar specialist in the Royal to validate the type of corrosion pres- and used for diffcult to access and Navy and since joining Sonomatic has ent, can also be carried out along with hazardous inspection locations. Not become TOFD level ll qualifed.
oedigital.com July 2013 | OE 31 030_OE_0713_MF1_MagRov.indd 31 6/25/13 1:05 AM