
Page 33: of Offshore Engineer Magazine (Aug/Sep 2013)
Read this page in Pdf, Flash or Html5 edition of Aug/Sep 2013 Offshore Engineer Magazine
 32
32
 34
34
Geology & Geophysics
Eyebrow
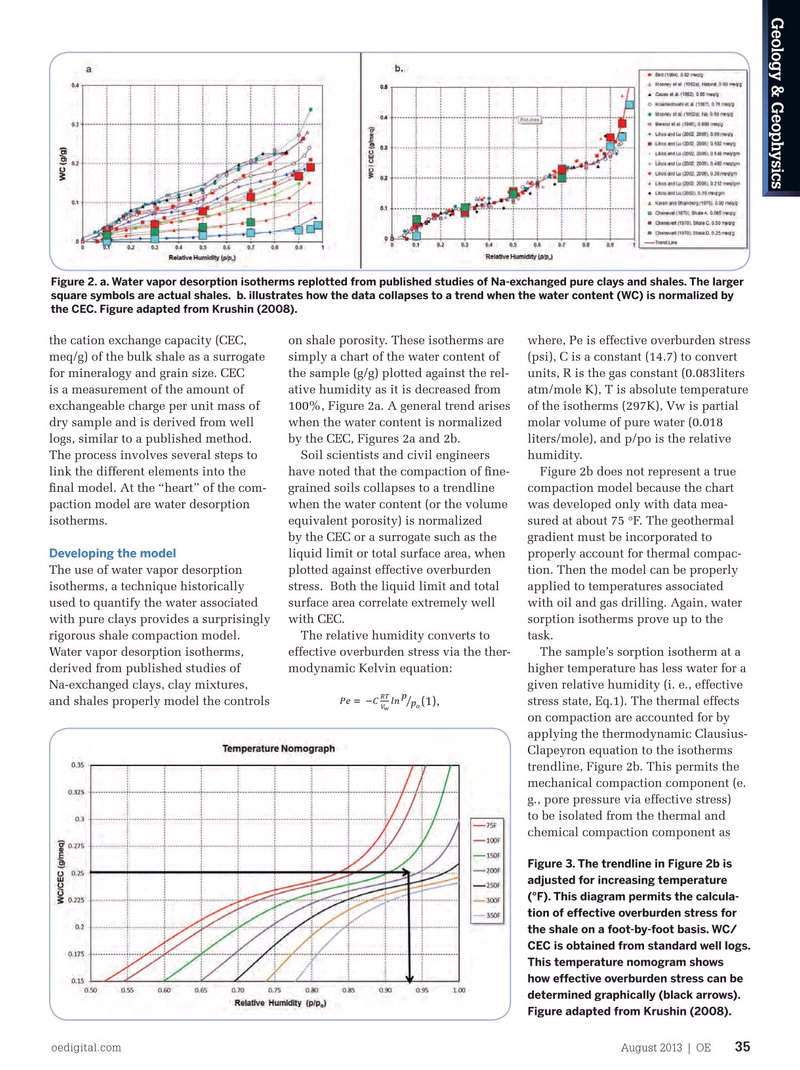
Figure 2. a. Water vapor desorption isotherms replotted from published studies of Na-exchanged pure clays and shales. The larger square symbols are actual shales. b. illustrates how the data collapses to a trend when the water content (WC) is normalized by the CEC. Figure adapted from Krushin (2008). the cation exchange capacity (CEC, on shale porosity. These isotherms are where, Pe is effective overburden stress meq/g) of the bulk shale as a surrogate simply a chart of the water content of (psi), C is a constant (14.7) to convert for mineralogy and grain size. CEC the sample (g/g) plotted against the rel- units, R is the gas constant (0.083liters is a measurement of the amount of ative humidity as it is decreased from atm/mole K), T is absolute temperature exchangeable charge per unit mass of 100%, Figure 2a. A general trend arises of the isotherms (297K), Vw is partial dry sample and is derived from well when the water content is normalized molar volume of pure water (0.018 logs, similar to a published method. by the CEC, Figures 2a and 2b. liters/mole), and p/po is the relative
The process involves several steps to Soil scientists and civil engineers humidity. link the different elements into the have noted that the compaction of fne- Figure 2b does not represent a true fnal model. At the “heart” of the com- grained soils collapses to a trendline compaction model because the chart paction model are water desorption when the water content (or the volume was developed only with data mea- isotherms. equivalent porosity) is normalized sured at about 75 °F. The geothermal by the CEC or a surrogate such as the gradient must be incorporated to liquid limit or total surface area, when properly account for thermal compac-
Developing the model
The use of water vapor desorption plotted against effective overburden tion. Then the model can be properly isotherms, a technique historically stress. Both the liquid limit and total applied to temperatures associated used to quantify the water associated surface area correlate extremely well with oil and gas drilling. Again, water with pure clays provides a surprisingly with CEC. sorption isotherms prove up to the rigorous shale compaction model. The relative humidity converts to task.
Water vapor desorption isotherms, effective overburden stress via the ther- The sample’s sorption isotherm at a derived from published studies of modynamic Kelvin equation: higher temperature has less water for a
Na-exchanged clays, clay mixtures, given relative humidity (i. e., effective and shales properly model the controls (1), stress state, Eq.1). The thermal effects on compaction are accounted for by applying the thermodynamic Clausius-
Clapeyron equation to the isotherms trendline, Figure 2b. This permits the mechanical compaction component (e. g., pore pressure via effective stress) to be isolated from the thermal and chemical compaction component as
Figure 3. The trendline in Figure 2b is adjusted for increasing temperature (°F). This diagram permits the calcula- tion of effective overburden stress for the shale on a foot-by-foot basis. WC/
CEC is obtained from standard well logs.
This temperature nomogram shows how effective overburden stress can be determined graphically (black arrows).
Figure adapted from Krushin (2008).
oedigital.com August 2013 | OE 35 034_OE0813_GandG.indd 35 7/22/13 12:31 AM