
Page 34: of Offshore Engineer Magazine (Aug/Sep 2013)
Read this page in Pdf, Flash or Html5 edition of Aug/Sep 2013 Offshore Engineer Magazine
 33
33
 35
35
effective stress relationship: (2), where, Pp is model derived pore pres- sure, OB is total overburden pressure, commonly derived from integration of the density log and Pe is derived from
Geology & Geophysics relative humidity (Eq. 1). All units are psi.
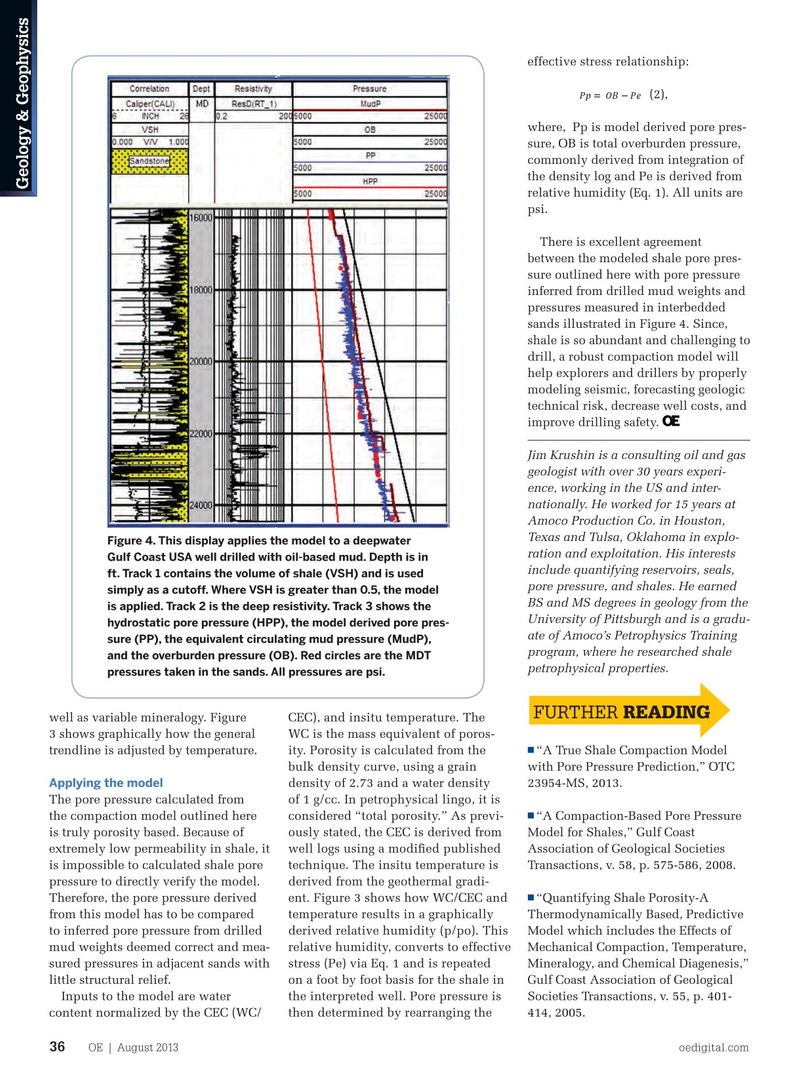
There is excellent agreement between the modeled shale pore pres- sure outlined here with pore pressure inferred from drilled mud weights and pressures measured in interbedded sands illustrated in Figure 4. Since, shale is so abundant and challenging to drill, a robust compaction model will help explorers and drillers by properly modeling seismic, forecasting geologic technical risk, decrease well costs, and improve drilling safety.
Jim Krushin is a consulting oil and gas geologist with over 30 years experi- ence, working in the US and inter- nationally. He worked for 15 years at
Amoco Production Co. in Houston,
Texas and Tulsa, Oklahoma in explo-
Figure 4. This display applies the model to a deepwater ration and exploitation. His interests
Gulf Coast USA well drilled with oil-based mud. Depth is in include quantifying reservoirs, seals, ft. Track 1 contains the volume of shale (VSH) and is used pore pressure, and shales. He earned simply as a cutoff. Where VSH is greater than 0.5, the model
BS and MS degrees in geology from the is applied. Track 2 is the deep resistivity. Track 3 shows the
University of Pittsburgh and is a gradu- hydrostatic pore pressure (HPP), the model derived pore pres- ate of Amoco’s Petrophysics Training sure (PP), the equivalent circulating mud pressure (MudP), program, where he researched shale and the overburden pressure (OB). Red circles are the MDT petrophysical properties.
pressures taken in the sands. All pressures are psi.
FURTHER READING well as variable mineralogy. Figure CEC), and insitu temperature. The 3 shows graphically how the general WC is the mass equivalent of poros- n trendline is adjusted by temperature. ity. Porosity is calculated from the “A True Shale Compaction Model bulk density curve, using a grain with Pore Pressure Prediction,” OTC density of 2.73 and a water density 23954-MS, 2013.
Applying the model of 1 g/cc. In petrophysical lingo, it is
The pore pressure calculated from n considered “total porosity.” As previ- “A Compaction-Based Pore Pressure the compaction model outlined here ously stated, the CEC is derived from Model for Shales,” Gulf Coast is truly porosity based. Because of well logs using a modifed published Association of Geological Societies extremely low permeability in shale, it technique. The insitu temperature is Transactions, v. 58, p. 575-586, 2008.
is impossible to calculated shale pore derived from the geothermal gradi- pressure to directly verify the model. n ent. Figure 3 shows how WC/CEC and “Quantifying Shale Porosity-A
Therefore, the pore pressure derived temperature results in a graphically Thermodynamically Based, Predictive from this model has to be compared derived relative humidity (p/po). This Model which includes the Effects of to inferred pore pressure from drilled relative humidity, converts to effective Mechanical Compaction, Temperature, mud weights deemed correct and mea- stress (Pe) via Eq. 1 and is repeated Mineralogy, and Chemical Diagenesis,” sured pressures in adjacent sands with little structural relief. on a foot by foot basis for the shale in Gulf Coast Association of Geological
Inputs to the model are water the interpreted well. Pore pressure is Societies Transactions, v. 55, p. 401- content normalized by the CEC (WC/ then determined by rearranging the 414, 2005.
OE | August 2013 oedigital.com 36 034_OE0813_GandG.indd 36 7/22/13 4:56 PM