
Page 51: of Offshore Engineer Magazine (Sep/Oct 2013)
Read this page in Pdf, Flash or Html5 edition of Sep/Oct 2013 Offshore Engineer Magazine
 50
50
 52
52
Geology & Geophysics tow. The staged methodology pre- with beam migration to obtain a good and do not have the same artifcial sented uses the wide range of offsets to starting velocity trend and prevent FWI oscillation. Furthermore, offset gathers investigate the impact of long offsets from converging to a local minimum. from beam migrations also suggest that and full azimuth data on velocity the perturbation from Test #1 results inversion. in over-corrected gathers in the area
Offset stripping inversion
Starting with the lowest usable fre- immediately above the carbonate sec- quency content in the data, i.e. from tion. Test #2 produces fatter gathers.
Study area
The study area is in the deepwater 2-3Hz, the data is split into three offset
GOM, and is characterized by sedimen- classes: middle offsets (less than 8km),
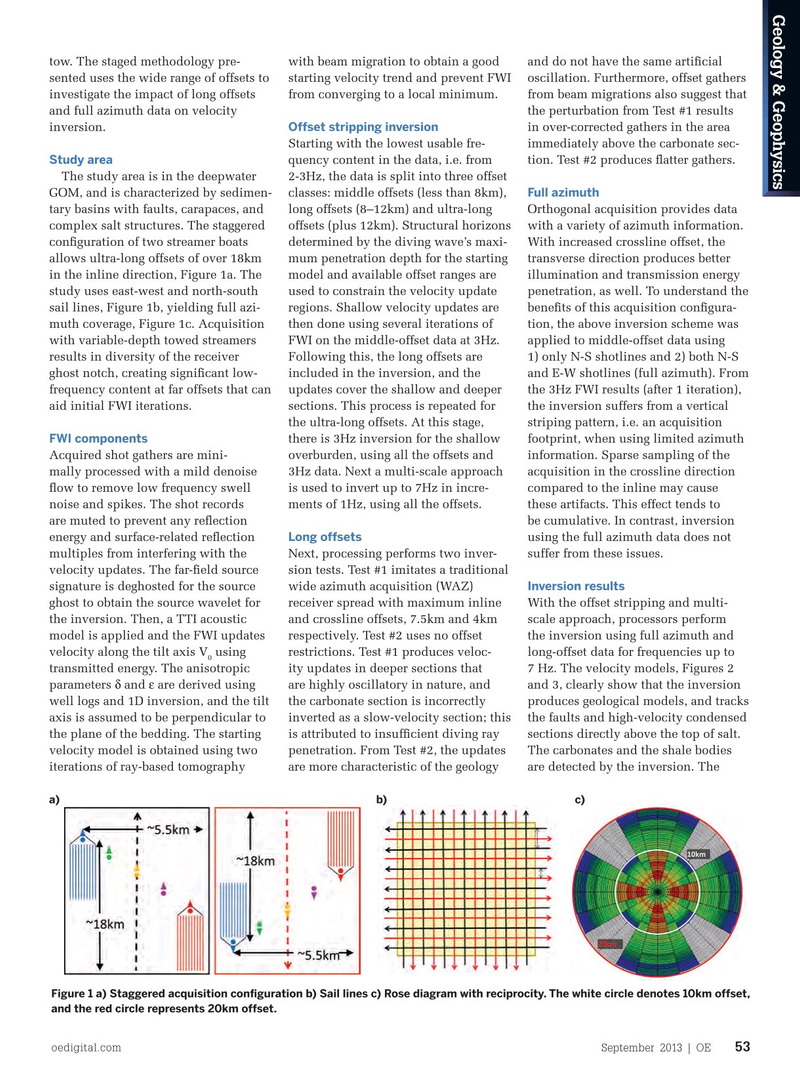
Full azimuth tary basins with faults, carapaces, and long offsets (8–12km) and ultra-long Orthogonal acquisition provides data complex salt structures. The staggered offsets (plus 12km). Structural horizons with a variety of azimuth information. confguration of two streamer boats determined by the diving wave’s maxi- With increased crossline offset, the allows ultra-long offsets of over 18km mum penetration depth for the starting transverse direction produces better in the inline direction, Figure 1a. The model and available offset ranges are illumination and transmission energy study uses east-west and north-south used to constrain the velocity update penetration, as well. To understand the sail lines, Figure 1b, yielding full azi- regions. Shallow velocity updates are benefts of this acquisition confgura- muth coverage, Figure 1c. Acquisition then done using several iterations of tion, the above inversion scheme was with variable-depth towed streamers FWI on the middle-offset data at 3Hz. applied to middle-offset data using results in diversity of the receiver Following this, the long offsets are 1) only N-S shotlines and 2) both N-S ghost notch, creating signifcant low- included in the inversion, and the and E-W shotlines (full azimuth). From frequency content at far offsets that can updates cover the shallow and deeper the 3Hz FWI results (after 1 iteration), aid initial FWI iterations. sections. This process is repeated for the inversion suffers from a vertical the ultra-long offsets. At this stage, striping pattern, i.e. an acquisition there is 3Hz inversion for the shallow footprint, when using limited azimuth
FWI components
Acquired shot gathers are mini- overburden, using all the offsets and information. Sparse sampling of the mally processed with a mild denoise 3Hz data. Next a multi-scale approach acquisition in the crossline direction fow to remove low frequency swell is used to invert up to 7Hz in incre- compared to the inline may cause noise and spikes. The shot records ments of 1Hz, using all the offsets. these artifacts. This effect tends to are muted to prevent any refection be cumulative. In contrast, inversion energy and surface-related refection using the full azimuth data does not
Long offsets multiples from interfering with the Next, processing performs two inver- suffer from these issues.
velocity updates. The far-feld source sion tests. Test #1 imitates a traditional signature is deghosted for the source wide azimuth acquisition (WAZ)
Inversion results ghost to obtain the source wavelet for receiver spread with maximum inline With the offset stripping and multi- the inversion. Then, a TTI acoustic and crossline offsets, 7.5km and 4km scale approach, processors perform model is applied and the FWI updates respectively. Test #2 uses no offset the inversion using full azimuth and velocity along the tilt axis V using restrictions. Test #1 produces veloc- long-offset data for frequencies up to 0 transmitted energy. The anisotropic ity updates in deeper sections that 7 Hz. The velocity models, Figures 2 parameters d and e are derived using are highly oscillatory in nature, and and 3, clearly show that the inversion well logs and 1D inversion, and the tilt the carbonate section is incorrectly produces geological models, and tracks axis is assumed to be perpendicular to inverted as a slow-velocity section; this the faults and high-velocity condensed the plane of the bedding. The starting is attributed to insuffcient diving ray sections directly above the top of salt. velocity model is obtained using two penetration. From Test #2, the updates The carbonates and the shale bodies iterations of ray-based tomography are more characteristic of the geology are detected by the inversion. The a) b) c)
Figure 1 a) Staggered acquisition confguration b) Sail lines c) Rose diagram with reciprocity. The white circle denotes 10km offset, and the red circle represents 20km offset.
oedigital.com September 2013 | OE 53 052_OE0913_G&G1_CGG.indd 53 8/18/13 8:24 PM